

doi: 10.1162/REST_a_00670.
Epub 2018 Mar 2.
THE LOCAL INFLUENCE OF PIONEER INVESTIGATORS ON TECHNOLOGY ADOPTION: EVIDENCE FROM NEW CANCER DRUGS
Affiliations
- PMID: 29755142
- PMCID: PMC5947964
- DOI: 10.1162/REST_a_00670
Item in Clipboard
THE LOCAL INFLUENCE OF PIONEER INVESTIGATORS ON TECHNOLOGY ADOPTION: EVIDENCE FROM NEW CANCER DRUGS
Rev Econ Stat.
2018 Mar.
Abstract
Local opinion leaders may play a key role in easing information frictions associated with technology adoption. This paper analyzes the influence of physician investigators who lead clinical trials for new cancer drugs. By comparing diffusion patterns across 21 new cancer drugs, we separate correlated regional demand for new technology from information spillovers. Patients in the lead investigator's region are initially 36% more likely to receive the new drug, but utilization converges within four years. We also find that superstar physician authors, measured by trial role or citation history, have broader influence than less prominent authors.
Figures
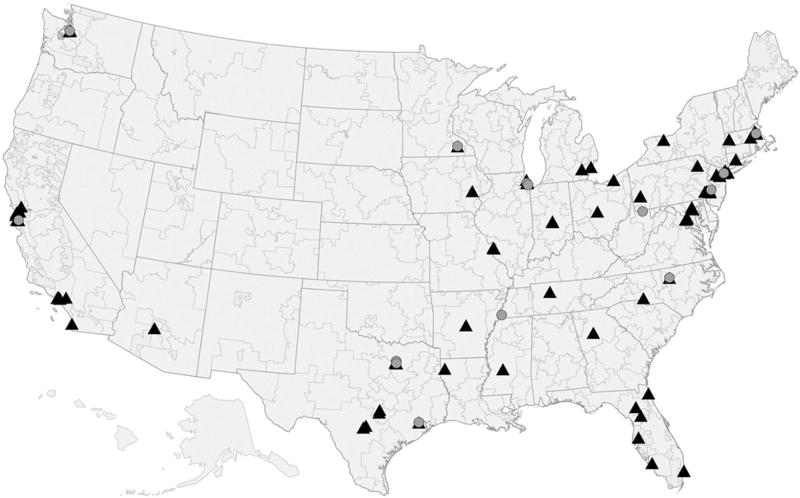
Circles mark the Hospital Referral Regions (HRR) that contain a first author for the pivotal clinical trial of a cancer drug in our sample. Some regions are the site of multiple first authors: Houston (four first authors); Chicago (three first authors); Durham, North Carolina (two first authors); and New York, New York (two first authors). Triangles mark HRRs that contain other authors.
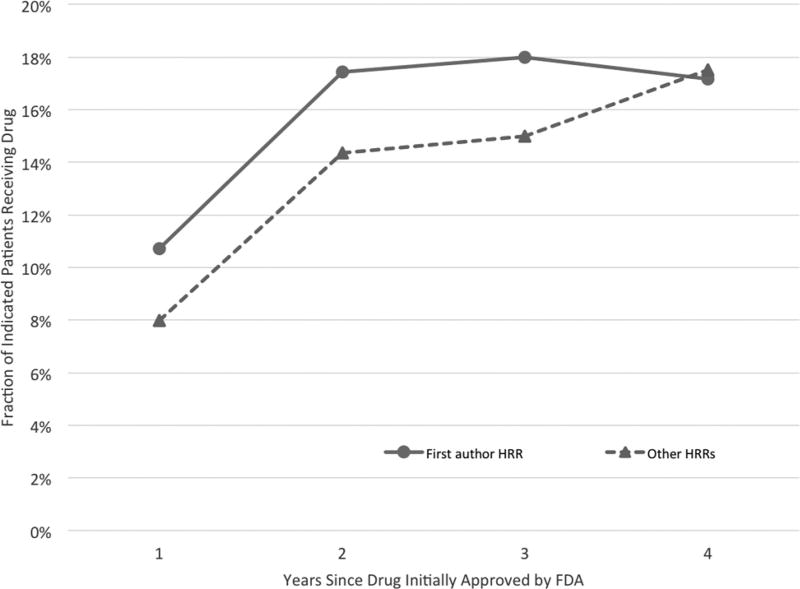
The figure plots raw usage for new drugs in the first author’s HRR versus all other HRRs. The “First author HRR” and “Other HRRs” rates are generated by averaging over the drug-specific first author HRR and non–first author HRR rates calculated separately for each drug in each year. To make rates over time comparable, we restrict to the 67% of drugs in our sample for which four years of usage rates are available.
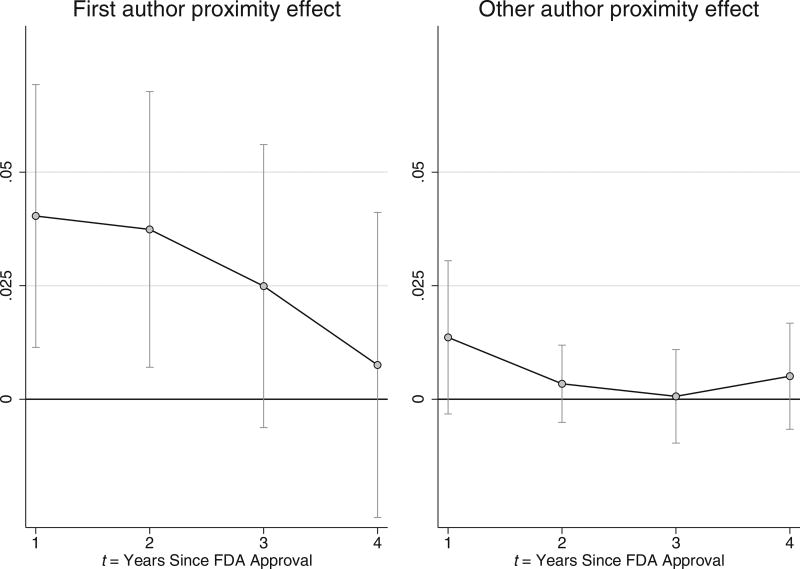
Graphs plot estimates of the effect pioneer investigator proximity has on drug utilization, t years since the corresponding cancer drug became FDA approved. Bands indicate 95% confidence intervals constructed from standard errors clustered at the provider HRR-drug level.
References
-
- Audretsch David B, Feldman Maryann P. Knowledge Spillovers and the Geography of Innovation. In: Henderson J Vernon, Thisse Jacques-François., editors. Handbook of Regional and Urban Economics. Vol. 4. Amsterdam: Elsevier; 2004. pp. 2713–2739.
-
- Azoulay Pierre, Graff Zivin Joshua S, Sampat Bhaven N. The Diffusion of Scientific Knowledge across Time and Space: Evidence from Professional Transitions for the Superstars of Medicine. Chicago: University of Chicago Press; 2012.
-
- Bach Peter B. Limits on Medicare’s Ability to Control Rising Spending on Cancer Drugs. New England Journal of Medicine. 2009;360:626–633. - PubMed
-
- Baerlocher Mark Otto, Newton Marshall, Gautam Tina, Tomlinson George, Detsky Allan S. The Meaning of Author Order in Medical Research. Journal of Investigative Medicine. 2007;55:174. - PubMed
Grants and funding
LinkOut - more resources
Full Text Sources
Other Literature Sources