

doi: 10.1007/s11214-016-0244-5.
Epub 2016 Mar 31.
The FIELDS Instrument Suite for Solar Probe Plus: Measuring the Coronal Plasma and Magnetic Field, Plasma Waves and Turbulence, and Radio Signatures of Solar Transients
Affiliations
- PMID: 29755144
- PMCID: PMC5942226
- DOI: 10.1007/s11214-016-0244-5
Item in Clipboard
The FIELDS Instrument Suite for Solar Probe Plus: Measuring the Coronal Plasma and Magnetic Field, Plasma Waves and Turbulence, and Radio Signatures of Solar Transients
Space Sci Rev.
2016 Dec.
Abstract
NASA's Solar Probe Plus (SPP) mission will make the first in situ measurements of the solar corona and the birthplace of the solar wind. The FIELDS instrument suite on SPP will make direct measurements of electric and magnetic fields, the properties of in situ plasma waves, electron density and temperature profiles, and interplanetary radio emissions, amongst other things. Here, we describe the scientific objectives targeted by the SPP/FIELDS instrument, the instrument design itself, and the instrument concept of operations and planned data products.
Keywords: Coronal heating; Solar Probe Plus.
Figures
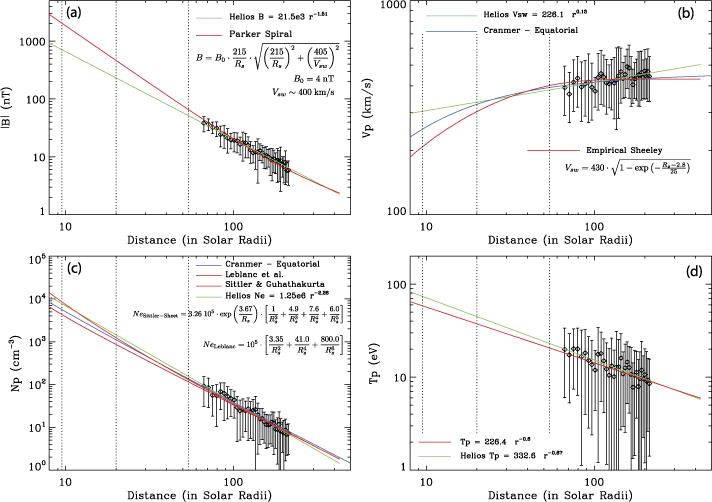
Radial evolution of (a) magnetic field intensity, (b) solar wind velocity, (c) proton density, and (d) proton temperature. Diamonds represent data from Helios 1 binned in distance, and the error bars are the standard deviation for each bin. Model extrapolations are shown in each panel
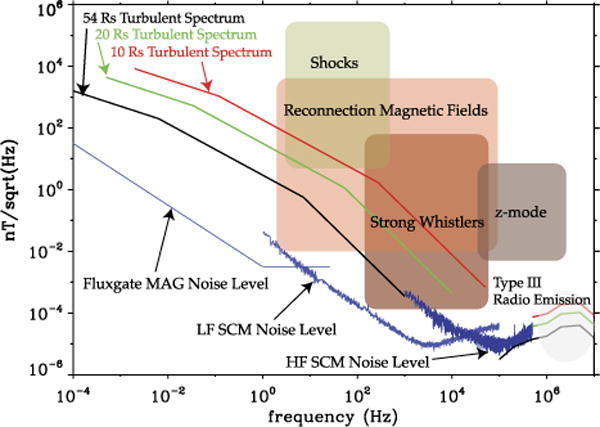
Estimates of the magnetic field fluctuation spectra at 54, 20 and 10 solar radii, together with the instruments MAG and SCM noise levels. These expected turbulence levels were obtained from breakpoint scalings. Also shown are the expected magnetic field fluctuation levels from shocks, reconnection fields, strong whistlers and z-modes over the SPP orbit
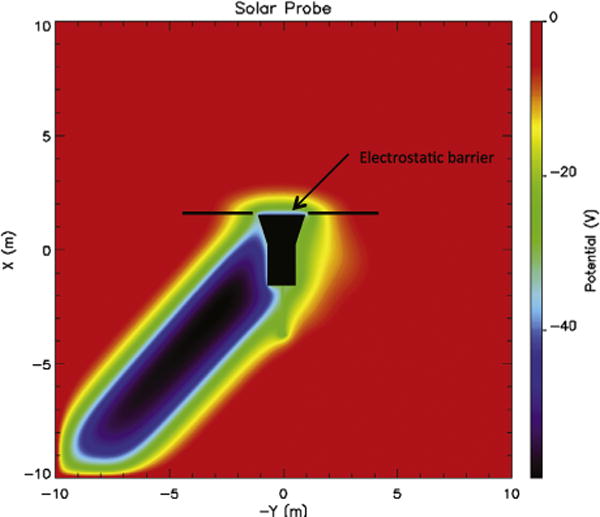
The electric potential surrounding a simple model of the SPP spacecraft near perihelion [see Ergun et al. 2010 for details on the simulation]. The X-direction is toward the sun. The Y-direction is the orbital track of the spacecraft. Color represents potential in volts. The thick black lines depict the electric field antennas. The plasma density is 7000 cm−3, the electron temperature is 85 eV and the ion temperature is 85 eV. The solar wind speed is 200 km/s and the spacecraft orbital speed is 180 km/s. The plot is in the frame of the spacecraft
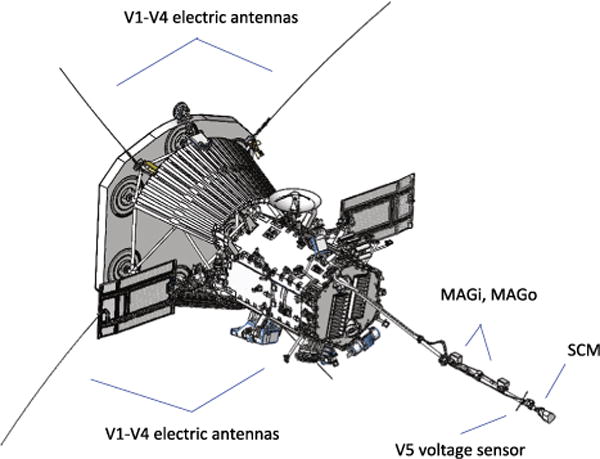
FIELDS uses 5 voltage and 3 magnetic sensors to measure electric and magnetic fields. The four V1–V4 sensors are deployed into full sunlight near the base of the SPP heat shield (TPS). A search coil magnetometer (SCM) is mounted at the end of the instrument boom. Two fluxgate magnetometers (MAGi and MAGo) and a simple voltage sensor V5 are also mounted on the boom
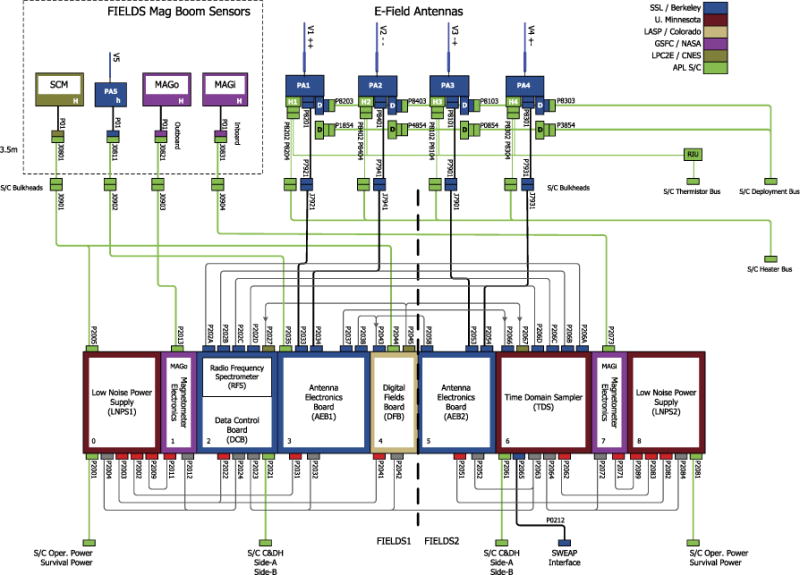
The FIELDS suite block diagram. Boom-mounted sensors are diagrammed in the upper left dotted box; these sensors are fixed to the boom and deploy with it. The four TPS-plane electric field/voltage sensors are deployed by actuation from the spacecraft. The Main Electronics Package (MEP) at the bottom is mounted within the spacecraft body and consists of two sides—FIELDS_1 and FIELDS_2—providing some redundancy in the case of power supply or computer failure. FIELDS also has a dedicated interface to the SWEAP instrument. Color-coding indicates institutional responsibility of each hardware component
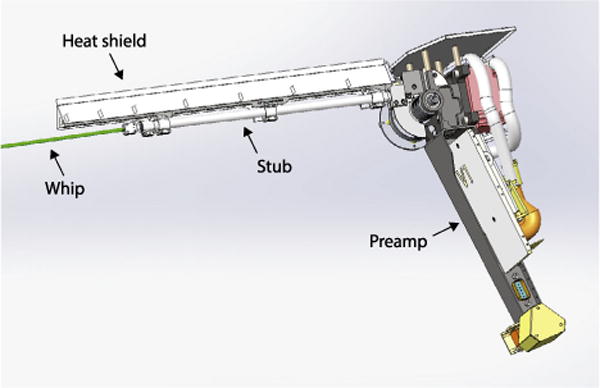
A CAD drawing of a V1–V4 antenna unit. The whip (colored green here) is the sensor and extends 2 meters beyond the end of the 30 cm stub. The stub acts as an electrical and thermal isolator. The niobium C103 whip signal is carried back through a small, pure niobium wire contained in the stub to the preamplifier at the base. A heat shield shadows the stub, allowing it to radiate excess heat from the whip, while another shield supports blanketing that blocks heat radiating from the TPS
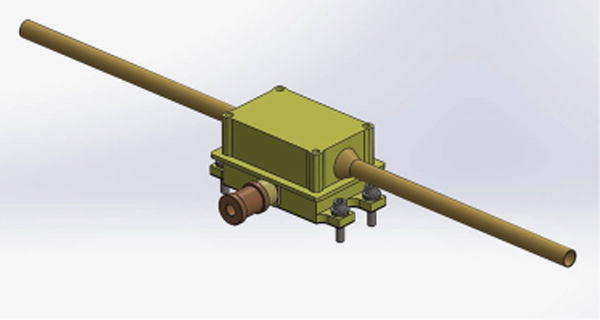
A CAD drawing of the V5 voltage sensor. Two short tubes act as a single (electrically tied) sensor to measure the plasma voltage. A simple preamplifier is housed in an attached enclosure. The tubes can be current-biased and the preamp enclosure can be voltage-biased
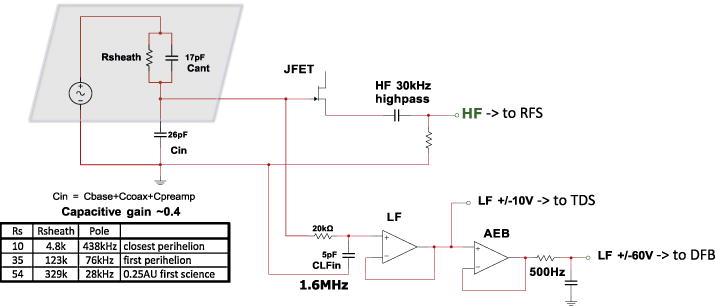
A simplified schematic of the V1–V4 electric preamplifier circuit. A signal from the antenna whip is fed into 3 separate channels that feed the DFB, TDS, and RFS receivers. The LF side using a floating voltage system to accommodate the large expected plasma voltage variations. The grey box in the upper left represents the plasma voltage signal and sheath impedance, and some estimated values of the sheath resistance are shown in the table within the figure
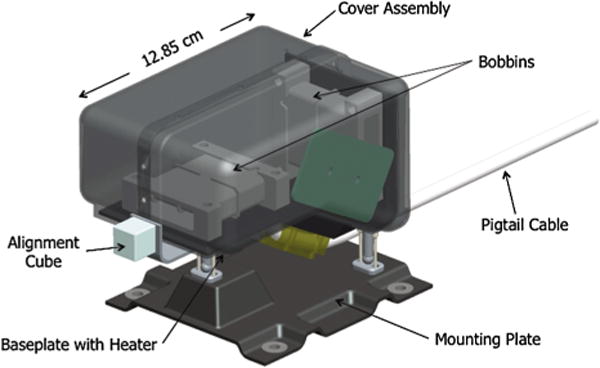
CAD drawing of a SPP MAG sensor, showing the composite structure supporting the two bobbins and electronics board (green) inside the composite cover. Also seen are two of the three kinetic mounts supporting the sensor on the composite 4-hole mounting plate, the alignment cube, and the pigtail harness that connects to the spacecraft harness
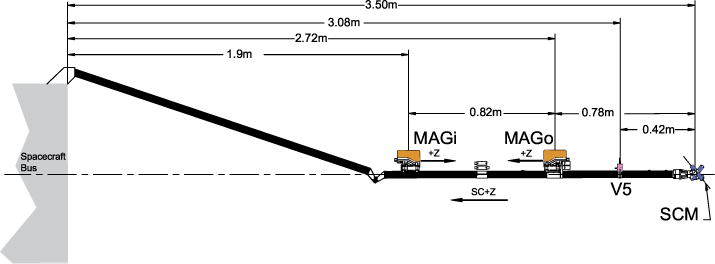
A schematic of the spacecraft magnetometer boom and sensors, shown deployed. Two fluxgate magnetometers are located at 1.9 m (MAGi) and 2.72 m (MAGo) from the rear deck of the spacecraft. The V5 voltage sensor is at 3.08 m and the search coil magnetometer (SCM) is located at the end of the boom: 3.5 m from the spacecraft. This is a relatively short boom, constrained to remain in the spacecraft umbra at perihelion. SCM data will require special processing to remove the drive signal from the fluxgates
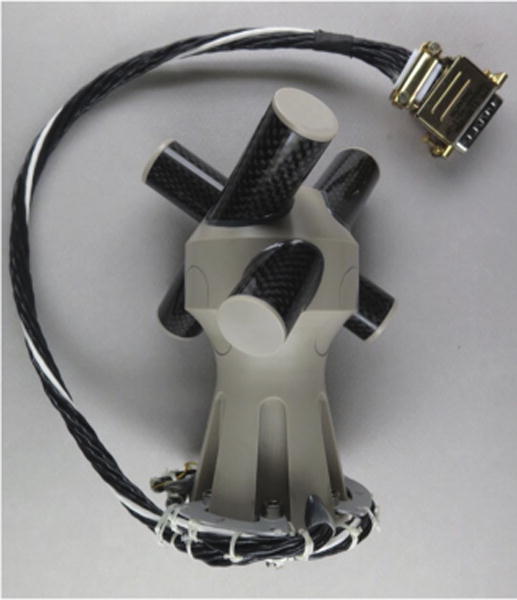
Engineering model of the search-coil magnetometer (SCM) for SPP
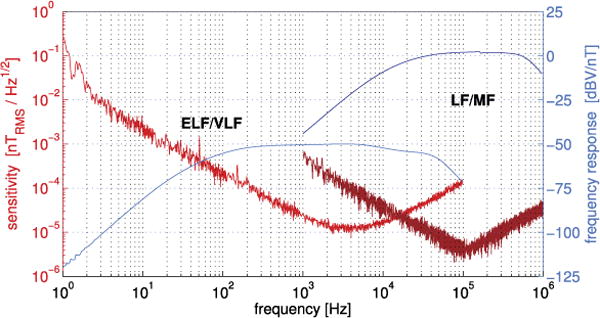
Measured sensitivity (in red) and frequency response (in blue) of SCM. The curves on the left are for the ELV/VLF antenna and the curves on the right for the LF/MF one. The highest measurable levels are 3000 nT in the ELF/VLF range, and 100 nT in the LF/MF range
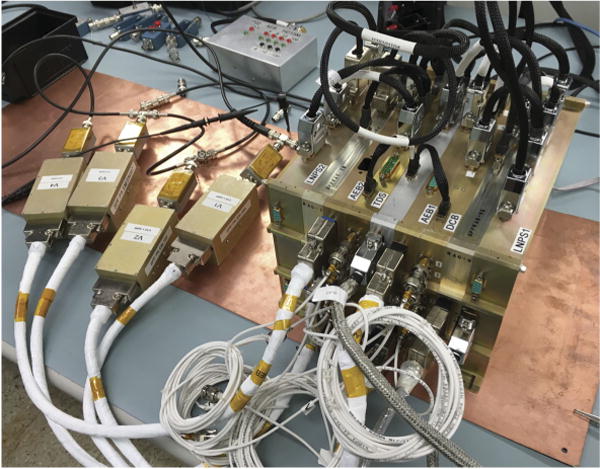
A photograph of the engineering model (EM) of the FIELDS main electronics package and V1–V4 preamps. The individual boards are labeled
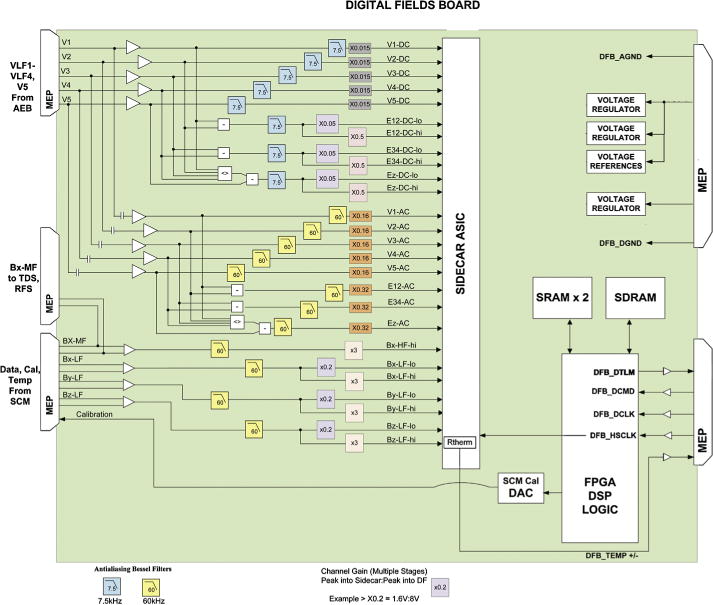
A block diagram of the DFB. The DFB processes 26 input signals into a Teledyne SIDECAR ASIC at 150 kSa/s and performs digital signal processing to produce spectral and cross-spectral matrices, in addition to time series data
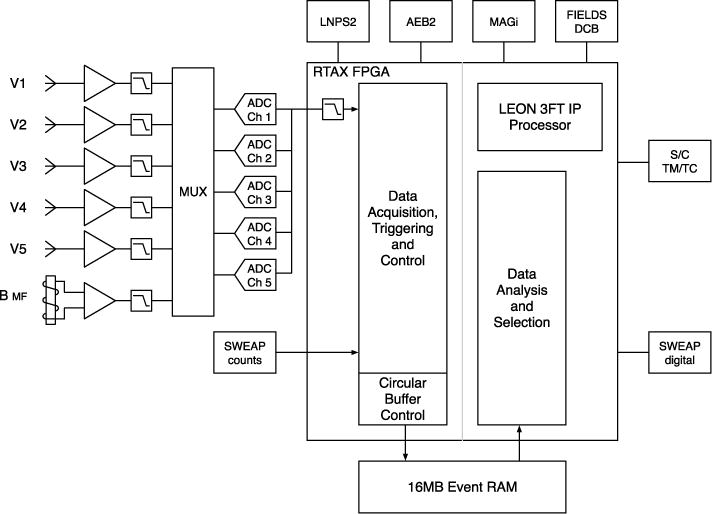
Block diagram of the TDS. The TDS processes 6 input signals at 1.92 MSa/s and produces waveform capture events organized and telemetered by quality. TDS also has a command and data handling (C&DH) interface to the spacecraft computer and can take over in the event of failure on the FIELDS1 side
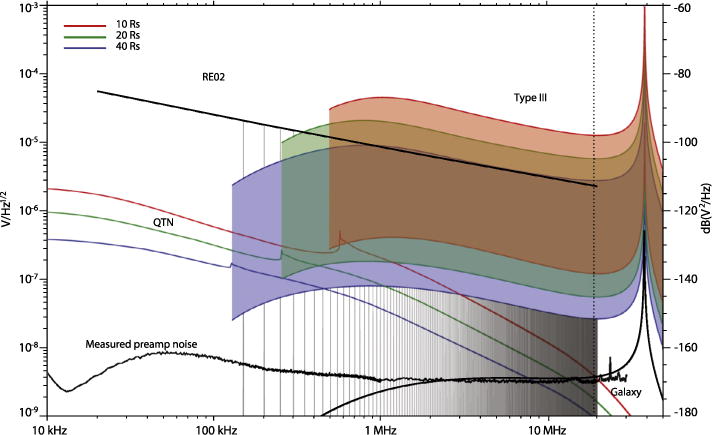
Expected signal levels across the quasi-thermal noise and radio frequency spectrum. Three colored bands show the expected intensity of radio emission associated with interplanetary type III radio bursts and 40 RS (lavender), 20 RS (green), and 10 RS (orange) and spectra of quasi-thermal noise (same color scheme). The spacecraft-level RE02 EMC level is shown as a solid black line. Narrow-band ‘spikes’ rising to the RE02 level show the allowable noise contamination (per system EMC specification). The FIELDS Radio Frequency Spectrometer (RFS) instrument will measure this spectrum and reject the noise signals using a Polyphase Filter Bank
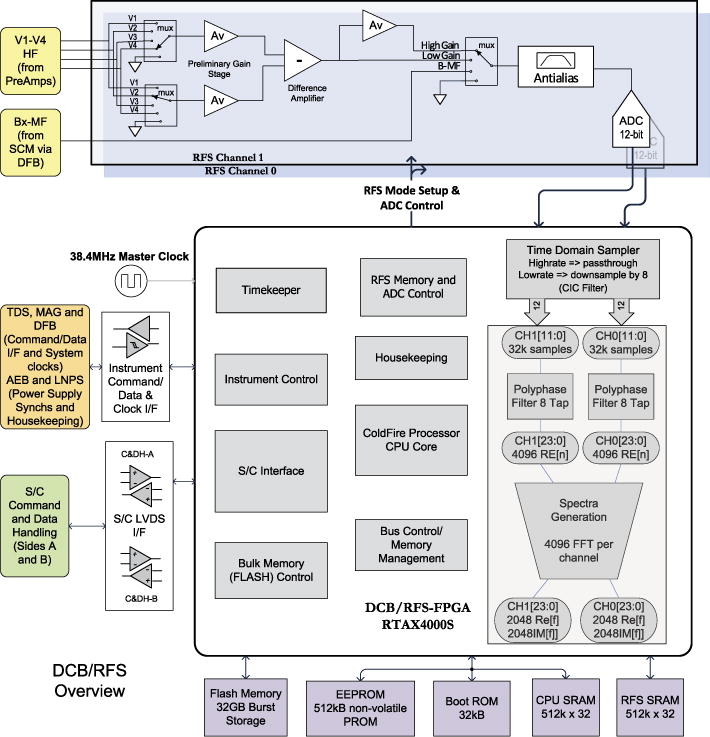
Block diagram of the DCB and RFS, which occupy a single board in the MEP. The DCB is the primary data processing and management module, and interface to the spacecraft C&DH system. RFS uses the DCB computer to perform signal processing of radio frequency measurements
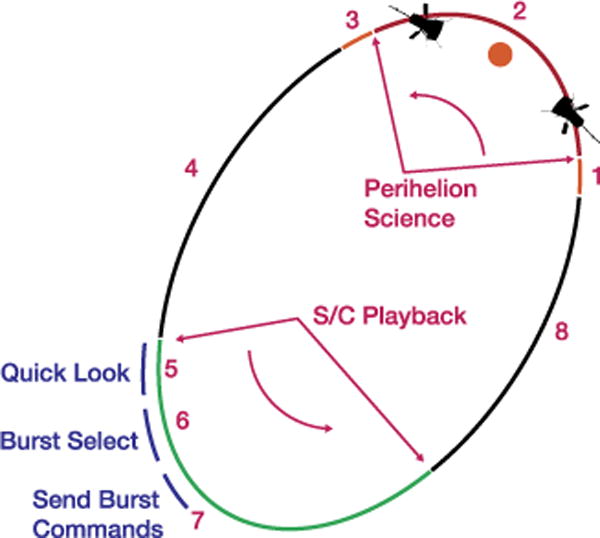
FIELDS orbit sequence showing data acquisition and playback intervals
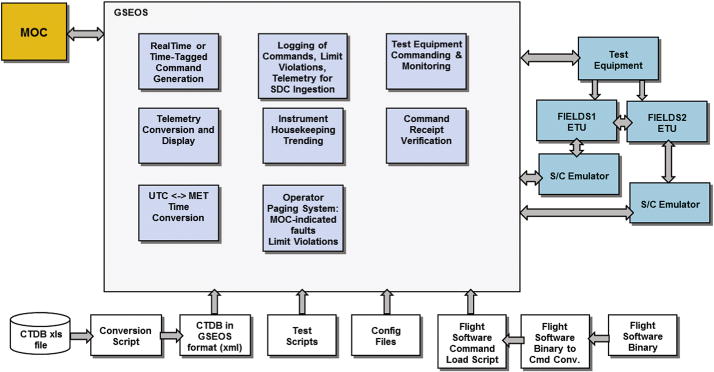
FIELDS CTG data flow diagram
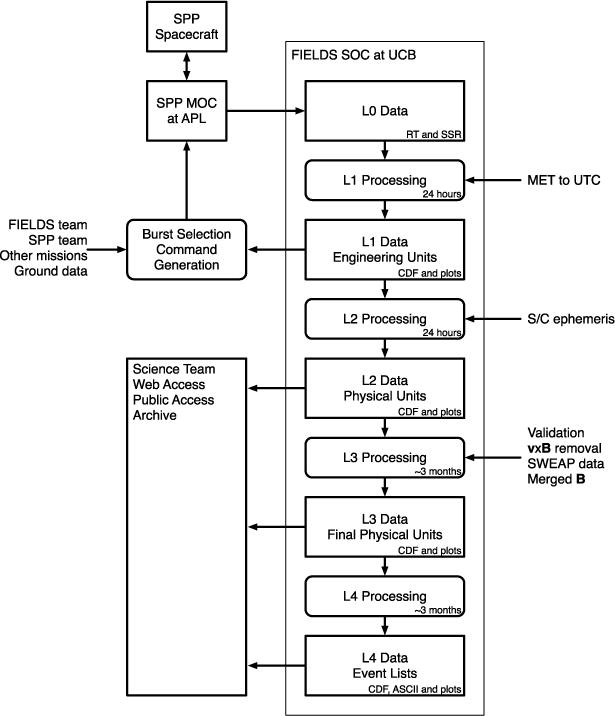
FIELDS data processing flow diagram
References
-
- Bavassano B, et al. Radial evolution of power spectra of interplanetary Alfvénic turbulence. J Geophys Res. 1982;87:3617–3622.
-
- Bruno R, Carbone V. The solar wind as a turbulence laboratory. Living Rev Sol Phys. 2005;2:4.
-
- Bonnell JW, et al. The electric field instrument (EFI) for THEMIS. Space Sci Rev. 2009;141:303–341.
-
- Bougeret JL, et al. WAVES: the radio and plasma wave investigation on the Wind mission. Space Sci Rev. 1995;71:231–263.
-
- Bougeret JL, et al. S/WAVES: the radio and plasma wave investigation on the STEREO mission. Space Sci Rev. 2008;136:487–528.
Grants and funding
LinkOut - more resources
Full Text Sources
Other Literature Sources
Miscellaneous