. 2018 Apr 18:12:92.
doi: 10.3389/fncel.2018.00092. eCollection 2018.

AMBRA1-Mediated Mitophagy Counteracts Oxidative Stress and Apoptosis Induced by Neurotoxicity in Human Neuroblastoma SH-SY5Y Cells

Affiliations

AMBRA1-Mediated Mitophagy Counteracts Oxidative Stress and Apoptosis Induced by Neurotoxicity in Human Neuroblastoma SH-SY5Y Cells

Anthea Di Rita et al. Front Cell Neurosci. .

Abstract

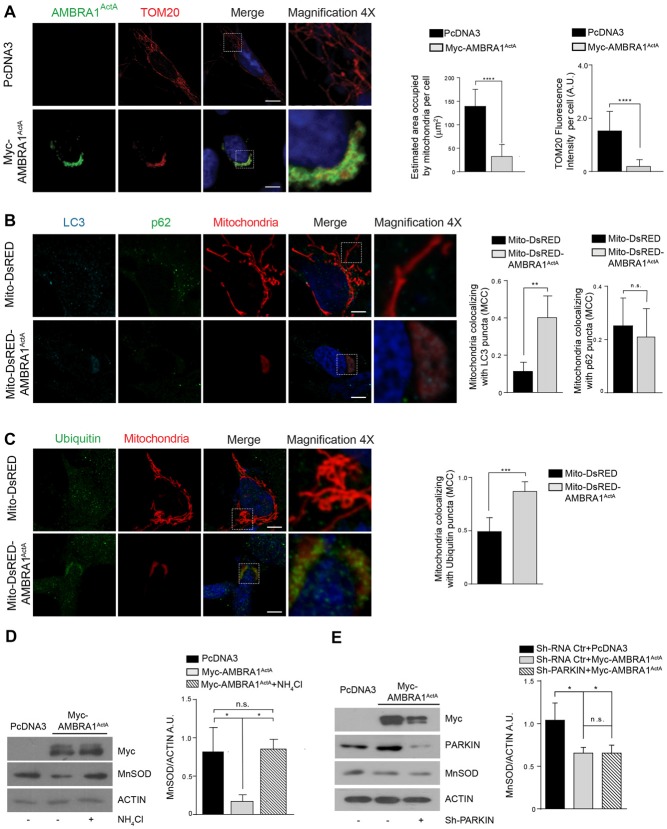
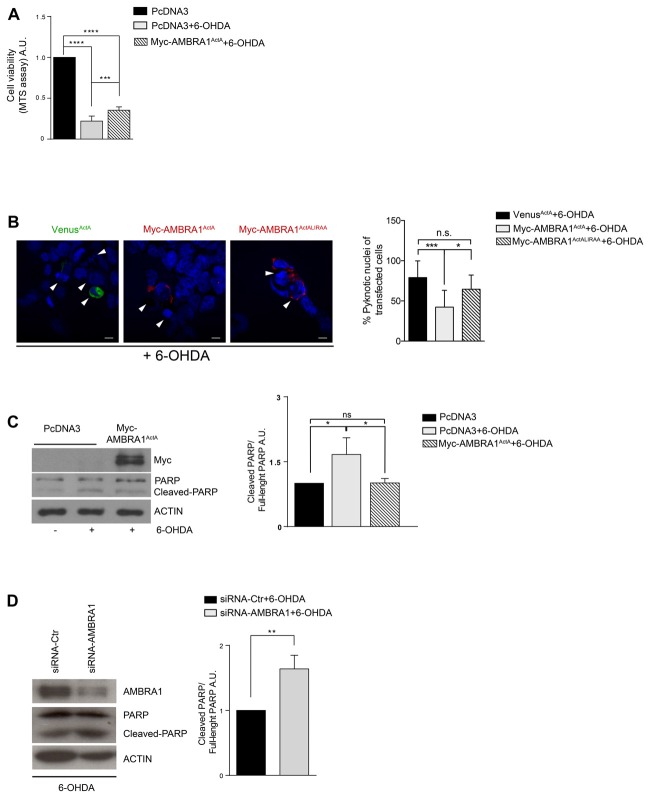
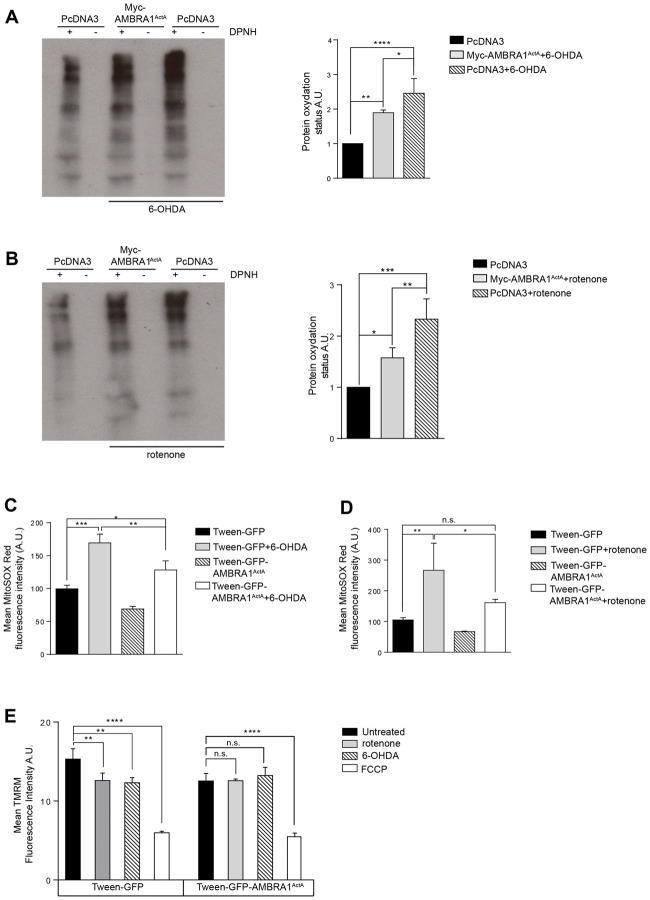
Therapeutic strategies are needed to protect dopaminergic neurons in Parkinson's disease (PD) patients. Oxidative stress caused by dopamine may play an important role in PD pathogenesis. Selective autophagy of mitochondria (mitophagy), mainly regulated by PINK1 and PARKIN, plays an important role in the maintenance of cell homeostasis. Mutations in those genes cause accumulation of damaged mitochondria, leading to nigral degeneration and early-onset PD. AMBRA1ActA is a fusion protein specifically expressed at the mitochondria, and whose expression has been shown to induce a powerful mitophagy in mammalian cells. Most importantly, the pro-autophagy factor AMBRA1 is sufficient to restore mitophagy in fibroblasts of PD patients carrying PINK1 and PARKIN mutations. In this study, we investigated the potential neuroprotective effect of AMBRA1-induced mitophagy against 6-hydroxydopamine (6-OHDA)- and rotenone-induced cell death in human neuroblastoma SH-SY5Y cells. We demonstrated that AMBRA1ActA overexpression was sufficient to induce mitochondrial clearance in SH-SY5Y cells. We found that apoptosis induced by 6-OHDA and rotenone was reversed by AMBRA1-induced mitophagy. Finally, transfection of SH-SY5Y cells with a vector encoding AMBRA1ActA significantly reduced 6-OHDA and rotenone-induced generation of reactive oxygen species (ROS). Altogether, our results indicate that AMBRA1ActA is able to induce mitophagy in SH-SY5Y cells in order to suppress oxidative stress and apoptosis induced by both 6-OHDA and rotenone. These results strongly suggest that AMBRA1 may have promising neuroprotective properties with an important role in limiting ROS-induced dopaminergic cell death, and the utmost potential to prevent PD or other neurodegenerative diseases associated with mitochondrial oxidative stress.

Keywords: Parkinson’s disease; cell death; in vitro models; mitophagy; oxidative stress.


Figures

Figure 1
Figure 1
AMBRA1ActA induces mitophagy in SH-SY5Y cell line. (A) SH-SY5Y cells transfected with PcDNA3 or Myc-AMBRA1ActA were immunostained with anti-Myc (green) and anti-TOM20 (red) antibodies. Scale bar, 10 μm. The upper and lower panels on the right are two magnifications (4×) of the mitochondria in transfected cells. The graphs show the estimated area occupied by mitochondria per cell and the TOM20 fluorescence intensity per cell (± S.D). n = 3 independent experiments. Statistical analysis was performed using Student’s T-test. ****P < 0.0001. (B) SH-SY5Y cells were transfected with vectors encoding Mito-DsRED or Mito-DsRED-AMBRA1ActA in order to mark wild type mitochondria and mitoaggresomes, respectively. Subsequently, cells were fixed and immunostained for the autophagosome marker LC3 (blue), the mitophagy receptor p62 (green) and counterstained with DAPI (blue). The graphs summarize the quantification in single cells of the manders colocalization coefficient (MCC) of mitochondria on the LC3 signal (left) or p62 signal (right). The upper and lower panels on the right are two magnifications (4×) of the mitochondria in transfected cells. Ten random fields of three independent experiments were considered. Data are presented as Mean ± S.D. Statistical test: student T-test. Scale bar: 5 μm. **P < 0.01; n.s. not statistically significant. (C) SH-SY5Y cells transfected as described in (B), were immunostained for Ubiquitin (green) and counterstained with DAPI (blue). The graph shows the quantification in single cells of the MCC of mitochondria on the Ub signal. The upper and lower panels on the right are two magnifications (4×) of the mitochondria in transfected cells. Ten random fields of three independent experiments were considered. Data are presented as Mean ± S.D. Statistical test: student T-test. Scale bar: 5 μm. ***P < 0.001. (D) PcDNA3 or Myc-AMBRA1ActA transfected cells, treated with the lysosome inhibitor NH4Cl, were analyzed by western blotting analysis for the indicated antibody. The graph shows the MnSOD/ACTIN ratio. Statistical analysis was performed using One-way ANOVA. *P < 0.05; n.s. not statistically significant. n = 3 independent experiments. (E) SH-SY5Y cells were transfected with Sh-PARKIN or Sh-RNA Ctr in combination with a vector coding for Myc-AMBRA1ActA. Total lysates were subjected to western blotting analysis using anti-MnSOD (to analyze mitochondrial clearance), anti-Myc or anti-PARKIN to assess Myc-AMBRA1ActA or Sh-PARKIN transfections, respectively. The quantification represents the MnSOD/ACTIN ratio. Statistical analysis was performed using One-way ANOVA. *P < 0.05; n.s. not statistically significant. n = 3 independent experiments.
Figure 2
Figure 2
AMBRA1ActA improves vitality of SH-SY5Y cells treated with 6-hydroxydopamine (6-OHDA). (A) SH-SY5Y cells were transfected with vectors coding for PcDNA3 or for Myc-AMBRA1ActA and 6 h after transfection, cells were treated with 6-OHDA (100 μM). Viable cells were estimated using the MTS assay. Results are expressed as A.U. Each point represents the mean (± SD) of triplicate wells from three independent experiments. Statistical analysis was performed using One-way ANOVA. ****P < 0.0001; ***P < 0.001. (B) SH-SY5Y cells were transfected with vectors encoding VenusActA or Myc-AMBRA1ActA or Myc-AMBRA1ActALIRAA plasmids for 24 h. Six hours after transfection, cells were treated with 6-OHDA (100 μM). Cells were then fixed and stained with DAPI. Cells with condensed or fragmented nuclei were scored as pyknotic (arrows indicate pyknotic nuclei). The graph shows the percentage of pyknotic nuclei in transfected cells. For each condition, transfected cells were counted in random fields from three independent experiments. Statistical analysis was performed using One way ANOVA. ***P < 0.001; *P < 0.05; n.s. not statistically significant. (C) SH-SY5Y cells were transfected with vectors encoding PcDNA3 or Myc-AMBRA1ActA for 24 h. Six hours after transfection, cells were treated with 6-OHDA (100 μM). After proteins extraction, we performed a western blot analysis using antibodies directed against AMBRA1 (Myc), PARP and ACTIN. The graph shows the cleaved PARP/Full-length PARP ratio resulting as the mean of three independent experiments (± S.D). n = 3. Statistical analysis was performed using One-way ANOVA, *P < 0.05. (D) SHSY5Y cells transfected with a siRNA-Ctr or siRNA-AMBRA1 were treated with 6-OHDA for 18 h. Total lysates were immunoblotted for AMBRA1, PARP and ACTIN antibodies. Statistical analysis was performed using One-way ANOVA. **P < 0.01. n = 3 independent experiments.
Figure 3
Figure 3
AMBRA1ActA improves vitality of SH-SY5Y cells treated with rotenone. (A) SH-SY5Y cells were transfected with vectors coding for PcDNA3 or for Myc-AMBRA1ActA and then treated with rotenone (10 μM). Viable cells were estimated using the MTS assay. Results are expressed as arbitrary unit (A.U.). Each point represents the mean (± SD) of triplicate wells from three independent experiments. Statistical analysis was performed using One-way ANOVA. **P < 0.01. *P < 0.05. (B) SH-SY5Y cells were transfected with vectors encoding Venus-ActA or Myc-AMBRA1ActA or Myc- AMBRA1ActALIRAA for 24 h. Six hours after transfection, cells were treated with rotenone (10 μM). After DAPI staining, cells with condensed or fragmented nuclei were scored as pyknotic (arrows indicate pyknotic nuclei). The graph shows the percentage of pyknotic nuclei in transfected cells (± S.D). For each condition, transfected cells were counted in random fields from three independent experiments. Statistical analysis was performed using One-way ANOVA. ****P < 0.0001; ***P < 0.001; *P < 0.05. (C) SH-SY5Y cells were transfected with vectors encoding PcDNA3 or Myc-AMBRA1ActA for 24 h. Six hours after transfection, cells were treated with rotenone (10 μM). After extraction of proteins, we performed a western blot analysis using antibodies directed against AMBRA1 (Myc), PARP/Cleaved-PARP and ACTIN. The graph shows the cleaved PARP/full-length PARP ratio, resulting as the mean of three independent experiments (± S.D). n = 3. One-way ANOVA, *P < 0.05. (D) SHSY5Y cells transfected with a siRNA-Ctr or siRNA-AMBRA1 were treated with 6-OHDA for 18 h. Total lysates were subjected to immunoblotting for AMBRA1, PARP and ACTIN antibodies. The graph represents the cleaved PARP/Full-length PARP ratio (± S.D). Statistical analysis was performed using One-way ANOVA. *P < 0.05. n = 3 independent experiments.
Figure 4
Figure 4
AMBRA1ActA reduces oxidative stress induced by 6-OHDA and rotenone treatments in SH-SY5Y cells. (A) Protein carbonylation analysis of SH-SY5Y cells transfected with vectors encoding PcDNA3 or Myc-AMBRA1ActA for 24 h and treated or not with 6-OHDA. The graph showing protein oxidation status (A.U.) results as the mean of three independent experiments (± S.D). Statistical analysis was performed using One-way ANOVA. ****P < 0.0001; **P < 0.01; *P < 0.05. n = 3 independent experiments. (B) SH-SY5Y cells were transfected as indicated in (A) and treated or not with rotenone. The graph shows protein oxydation status (A.U.) and results as the mean of three independent experiments (± S.D). Statistical analysis was performed using One-way ANOVA. ***P < 0.001; **P < 0.01; *P < 0.05. n = 3 independent experiments. (C) SH-SY5Y cells were transfected with constructs encoding Tween-GFP or Tween-GFP-AMBRA1ActA for 24 h and treated or not with 6-OHDA. Cells were subsequently stained with MitoSOX Red and analyzed by flow cytometry to measure the fluorescence intensity of the dye in GFP positive cells. Data are presented as Mean ± S.D of four independent experiments. Statistical test: One-way ANOVA. *P < 0.05; **P < 0.01; ***P < 0.001. (D) SH-SY5Y cells were transfected with constructs encoding Tween-GFP or Tween-GFP-AMBRA1ActA for 24 h and treated or not with rotenone. Cells were subsequently stained with MitoSOX Red and analyzed by flow cytometry to measure the fluorescence intensity of the dye in GFP positive cells. Data are presented as Mean ± S.D of four independent experiments. Statistical test: One-way ANOVA. *P < 0.05; **P < 0.01; ***P < 0.001; n.s.: not statistically significant. (E) SH-SY5Y cells were transfected with a plasmid encoding Tween-GFP or Tween-GFP-AMBRA1ActA and then treated or not with rotenone or 6-OHDA or FCCP. Cells were subsequently stained with 5 nM TMRM and analyzed by flow cytometry to measure the fluorescence intensity of the dye in GFP positive cells. Data are presented as Mean ± S.D of three independent experiments. Statistical test: One-way ANOVA. **P < 0.01; ****P < 0.0001; n.s.: not statistically significant.

References

    1. Betarbet R., Sherer T. B., MacKenzie G., Garcia-Osuna M., Panov A. V., Greenamyre J. T. (2000). Chronic systemic pesticide exposure reproduces features of Parkinson’s disease. Nat. Neurosci. 3, 1301–1306. 10.1038/81834 - DOI - PubMed
    1. Bolte S., Cordelières F. P. (2006). A guided tour into subcellular colocalization analysis in light microscopy. J. Microsc. 224, 213–232. 10.1111/j.1365-2818.2006.01706.x - DOI - PubMed
    1. Chin-Chan M., Navarro-Yepes J., Quintanilla-Vega B. (2015). Environmental pollutants as risk factors for neurodegenerative disorders: Alzheimer and Parkinson diseases. Front. Cell. Neurosci. 9:124. 10.3389/fncel.2015.00124 - DOI - PMC - PubMed
    1. Degli Esposti M., Ghelli A., Crimi M., Estornell E., Fato R., Lenaz G. (1993). Complex I and complex III of mitochondria have common inhibitors acting as ubiquinone antagonists. Biochem. Biophys. Res. Commun. 190, 1090–1096. 10.1006/bbrc.1993.1161 - DOI - PubMed
    1. Elkon H., Don J., Melamed E., Ziv I., Shirvan A., Offen D. (2002). Mutant and wild-type α-synuclein interact with mitochondrial cytochrome C oxidase. J. Mol. Neurosci. 18, 229–238. 10.1385/jmn:18:3:229 - DOI - PubMed

LinkOut - more resources