. 2018 Apr 26:9:557.
doi: 10.3389/fpls.2018.00557. eCollection 2018.

Iron Retention in Root Hemicelluloses Causes Genotypic Variability in the Tolerance to Iron Deficiency-Induced Chlorosis in Maize

Affiliations

Iron Retention in Root Hemicelluloses Causes Genotypic Variability in the Tolerance to Iron Deficiency-Induced Chlorosis in Maize

Rongli Shi et al. Front Plant Sci. .

Abstract

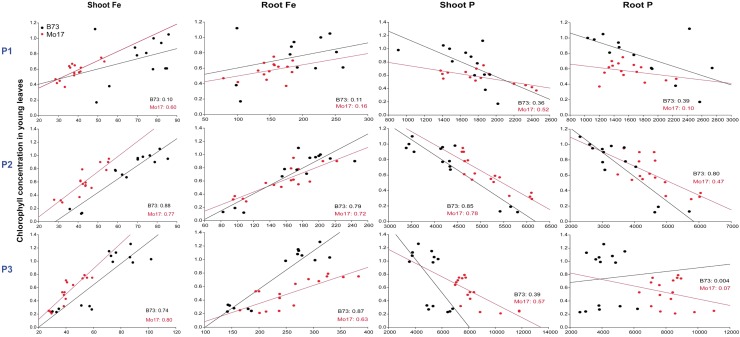
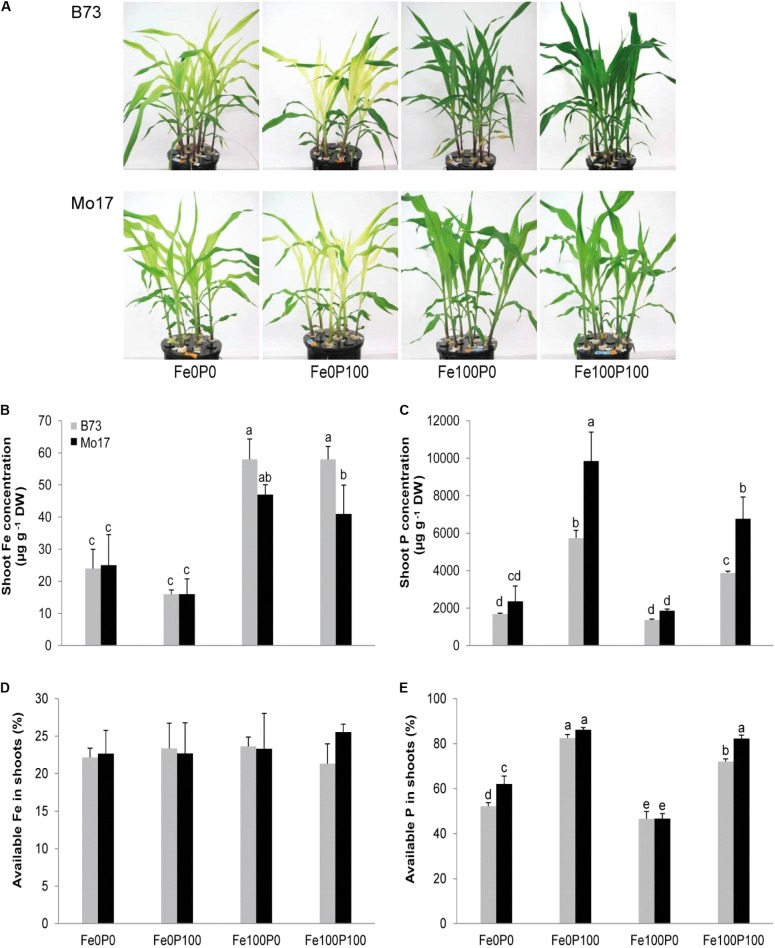
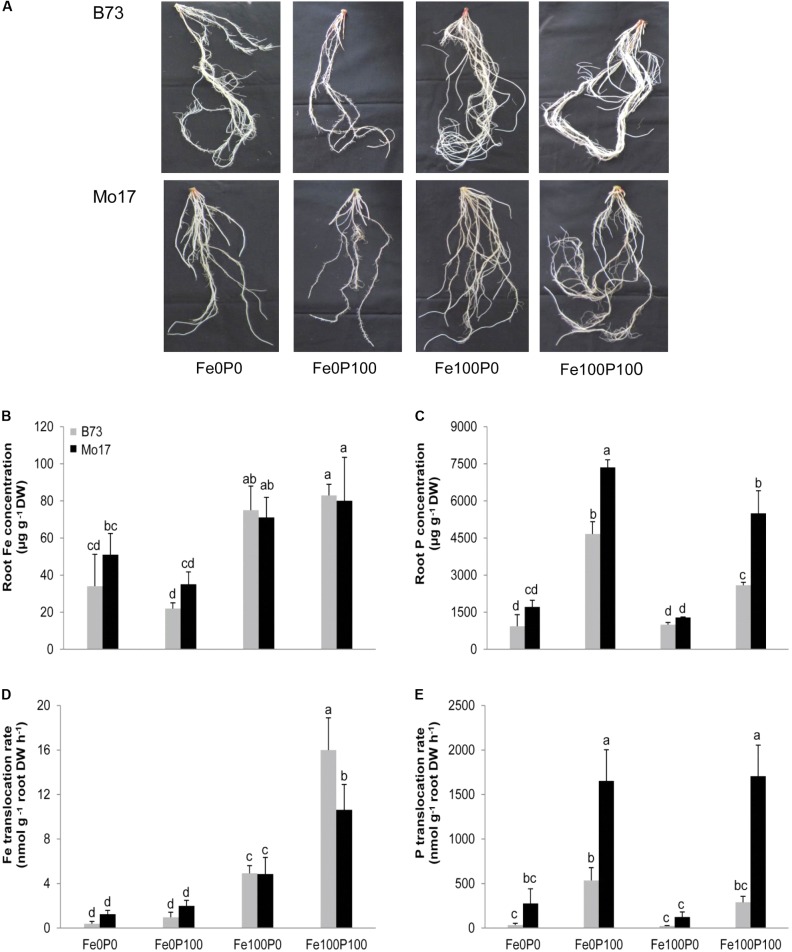
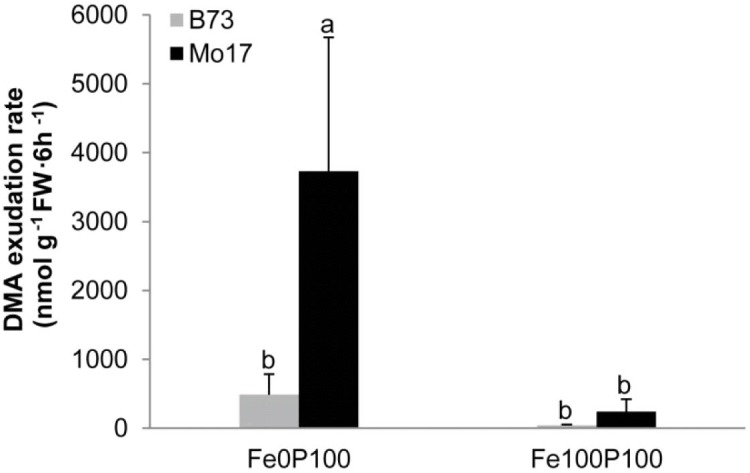
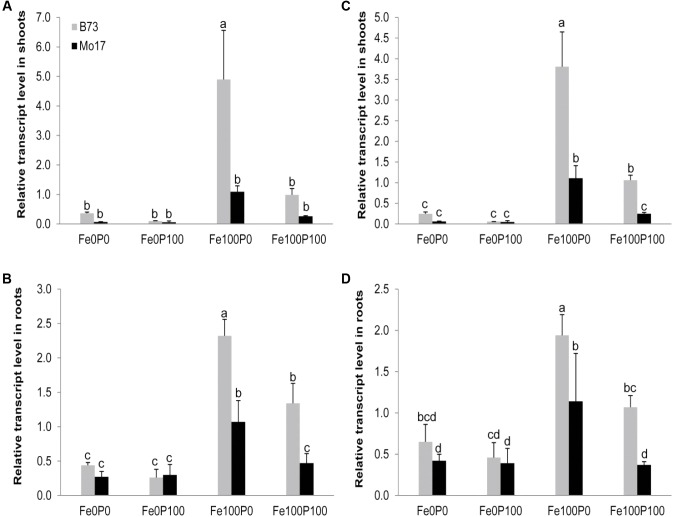
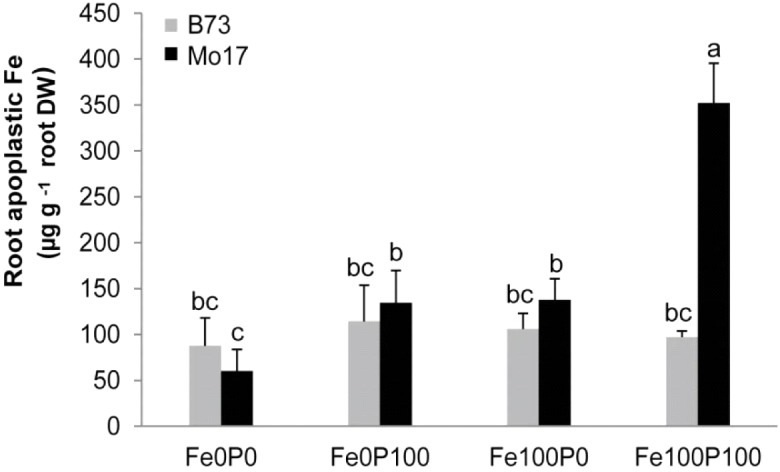
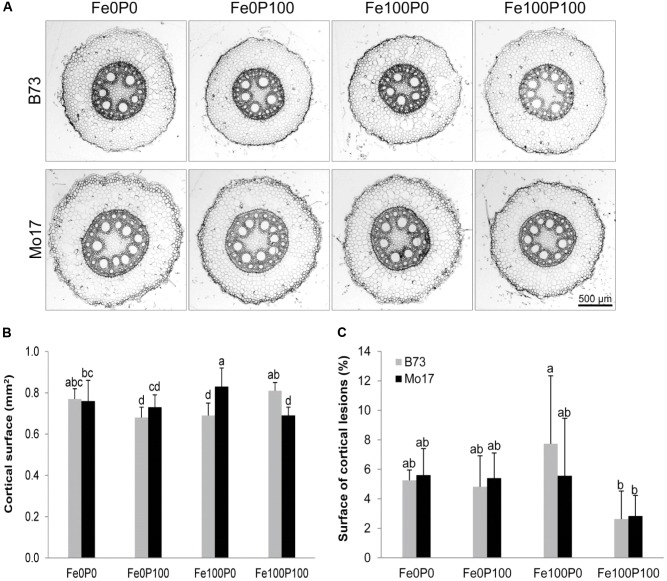
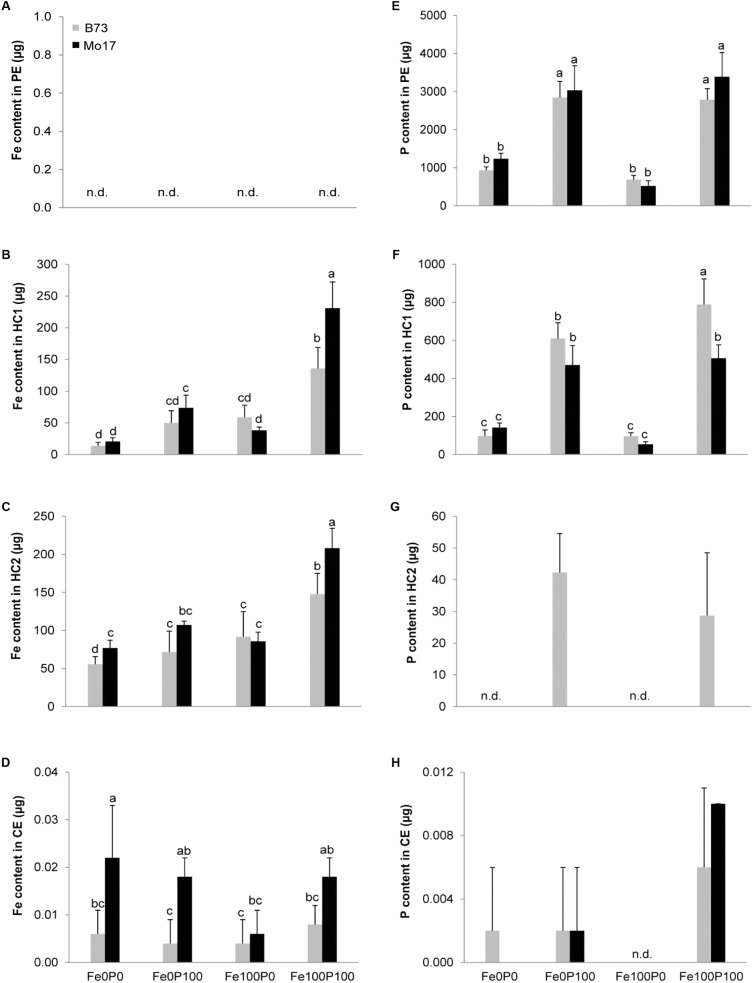
Antagonistic interactions of phosphorus (P) hamper iron (Fe) acquisition by plants and can cause Fe deficiency-induced chlorosis. To determine the physiological processes underlying adverse Fe-P interactions, the maize lines B73 and Mo17, which differ in chlorosis susceptibility, were grown hydroponically at different Fe:P ratios. In the presence of P, Mo17 became more chlorotic than B73. The higher sensitivity of Mo17 to Fe deficiency was not related to Fe-P interactions in leaves but to lower Fe translocation to shoots, which coincided with a larger pool of Fe being fixed in the root apoplast of P-supplied Mo17 plants. Fractionating cell wall components from roots showed that most of the cell wall-contained P accumulated in pectin, whereas most of the Fe was bound to root hemicelluloses, revealing that co-precipitation of Fe and P in the apoplast was not responsible for Fe inactivation in roots. A negative correlation between chlorophyll index and hemicellulose-bound Fe in 85 inbred lines of the intermated maize B73 × Mo17 (IBM) population indicated that apoplastic Fe retention contributes to genotypic differences in chlorosis susceptibility of maize grown under low Fe supplies. Our study indicates that Fe retention in the hemicellulose fraction of roots is an important determinant in the tolerance to Fe deficiency-induced chlorosis of graminaceous plant species with low phytosiderophore release, like maize.

Keywords: Fe deficiency; apoplastic iron; cell wall; iron–phosphorus interaction; strategy II.


Figures

FIGURE 1
FIGURE 1
Influence of varied Fe and P nutritional regimes on chlorophyll formation in the maize genotypes B73 and Mo17. Graphs show correlations between chlorophyll (in mg g-1) and Fe or P concentrations (in μg g-1) in shoots or roots of either B73 or Mo17 plants at each P supply level. Coefficients of correlation (r2) are indicated for either genotype within the plots. Plants were grown for 17 days in nutrient solution supplemented with 10, 50, or 200 μM P (P1–P3) and with 10, 30, 70, or 200 μM Fe (F1–F4) in all 12 combinations.
FIGURE 2
FIGURE 2
Shoot growth and nutrient concentrations as affected by Fe and P nutritional regimes in B73 and Mo17. (A) Shoot phenotype and concentrations of (B) Fe, (C) P, (D), and proportion of available Fe or (E) available P in shoots of B73 and Mo17. Plants were grown for 15 days in nutrient solution supplemented without Fe and P (Fe0P0), without Fe and with 100 μM P (Fe0P100), with 100 μM Fe and without P (Fe100P0) or with 100 μM Fe and 100 μM P (Fe100P100). Fe and P treatments were initiated after one week of preculture on full nutrient solution. Bars indicate mean values ± SD, n = 5. Different letters denote significant differences at p < 0.05.
FIGURE 3
FIGURE 3
Root growth and physiological root traits as affected by Fe and P nutritional regimes in B73 and Mo17. (A) Root anatomy and root concentrations of (B) Fe, (C) P, or root-to-shoot translocation rates of (D) Fe and (E) P as determined by collecting xylem sap. Plants were grown for 15 days in nutrient solution supplemented without Fe and P (Fe0P0), without Fe and with 100 μM P (Fe0P100), with 100 μM Fe and without P (Fe100P0) or with 100 μM Fe and 100 μM P (Fe100P100). Fe and P treatments were initiated after one week of preculture on full nutrient solution. Bars indicate means ± SD, n = 5. Different letters denote significant differences at p < 0.05.
FIGURE 4
FIGURE 4
Iron deficiency-induced phytosiderophore release by B73 and Mo17. Plants were grown in nutrient solution containing 100 μM P and 100 μM Fe (Fe100P100) or no Fe (Fe0P100). The whole system was cultivated under axenic conditions. Root exudates were collected three times over a period of 6 h and pooled prior to HPLC analysis of deoxy-mugineic acid (DMA). Bars indicate mean values ± SD, n = 5. Different letters denote significant differences at p < 0.05.
FIGURE 5
FIGURE 5
Influence of varied Fe and P nutritional regimes on ferritin gene expression. Relative transcript levels of ZmFer1 (A,B) and ZmFer2 (C,D) in shoots (A,C) and roots (B,D) of B73 and Mo17 plants grown for 15 days in nutrient solution supplemented without Fe and P (Fe0P0), without Fe and with 100 μM P (Fe0P100), with 100 μM Fe and without P (Fe100P0) or with 100 μM Fe and 100 μM P (Fe100P100). Fe and P treatments were initiated after one week of preculture on full nutrient solution. The housekeeping gene ZmGAPDH was used for normalization of mRNA levels, which were set to 1.0 in B73 grown at Fe100P100. Bars indicate mean values ± SD, n = 4. Different letters denote significant differences at p < 0.05.
FIGURE 6
FIGURE 6
Accumulation of apoplastic Fe under concomitant P supply in the two maize genotypes B73 and Mo17. Plants were grown for 15 days in nutrient solution supplemented without Fe and P (Fe0P0), without Fe and with 100 μM P (Fe0P100), with 100 μM Fe and without P (Fe100P0), or with 100 μM Fe and 100 μM P (Fe100P100). Fe and P treatments were initiated after one week of preculture on full nutrient solution. Bars indicate mean values ± SD, n = 5. Different letters denote significant differences at p < 0.05.
FIGURE 7
FIGURE 7
Influence of varied Fe and P nutritional regimes on root anatomy. (A) Anatomy of primary roots in cross sections, (B) cortical surface, and (C) surface of cortical lesions (expressed as proportion of lysed root tissue over the total root cross section). B73 and Mo17 plants were grown for 15 days in nutrient solution supplemented without Fe and P (Fe0P0), without Fe and with 100 μM P (Fe0P100), with 100 μM Fe and without P (Fe100P0), or with 100 μM Fe and 100 μM P (Fe100P100). Fe and P treatments were initiated after one week of preculture on full nutrient solution. Bars indicate mean values ± SD, n = 5. Different letters denote significant differences at p < 0.05.
FIGURE 8
FIGURE 8
Differential partitioning of Fe and P in cell wall fractions of maize roots. (A–D) Fe contents in pectin (PE), hemicellulose fraction-1 (HC1), hemicellulose fraction-2 (HC2), and cellulose (CE); (E–H) P contents in pectin (PE), hemicellulose fraction-1 (HC1), hemicellulose fraction-2 (HC2), and cellulose (CE). B73 and Mo17 plants were grown for 15 days in nutrient solution supplemented without Fe and P (Fe0P0), without Fe and with 100 μM P (Fe0P100), with 100 μM Fe, and without P (Fe100P0) or with 100 μM Fe and 100 μM P (Fe100P100). Fe and P treatments were initiated after one week of preculture on full nutrient solution. 1 g of root cell wall material was sequentially extracted for fractionation. Bars indicate mean values ± SD, n = 5. Different letters denote significant differences at p < 0.05.

References

    1. Ajakaiye C. O. (1979). Effect of phosphorus on growth and iron nutrition of millet and sorghum. Plant Soil 51 551–561. 10.1007/BF02277575 - DOI
    1. Benke A., Urbany C., Marsian J., Shi R. L., von Wirén N., Stich B. (2014). The genetic basis of natural variation for iron homeostasis in the maize IBM population. BMC Plant Biol. 14:12. 10.1186/1471-2229-14-12 - DOI - PMC - PubMed
    1. Bienfait H. F., Briel W. V. D., Mesland-Mul N. T. (1985). Free space iron pools in roots. Plant Physiol. 78 596–600. 10.1104/pp.78.3.596 - DOI - PMC - PubMed
    1. Bournier M., Tissot N., Mari S., Boucherez J., Lacombe E., Briat J. F. (2013). Arabidopsis ferritin 1 (AtFer1) gene regulation by the phosphate starvation response 1 (AtPHR1) transcription factor reveals a direct molecular link between iron and phosphate homeostasis. J. Biol. Chem. 288 22670–22680. 10.1074/jbc.M113.482281 - DOI - PMC - PubMed
    1. Carvalhais L. C., Dennis P. G., Fedoseyenko D., Hajirezaei M. R., Borriss R., von Wirén N. (2011). Root exudation of sugars, amino acids, and organic acids by maize as affected by nitrogen, phosphorus, potassium, and iron deficiency. J. Plant Nutr. Soil Sci. 174 3–11. 10.1002/jpln.201000085 - DOI

LinkOut - more resources