

Assessment of Multivariate Neural Time Series by Phase Synchrony Clustering in a Time-Frequency-Topography Representation
- PMID: 29755510
- PMCID: PMC5884284
- DOI: 10.1155/2018/2406909
Assessment of Multivariate Neural Time Series by Phase Synchrony Clustering in a Time-Frequency-Topography Representation
Abstract
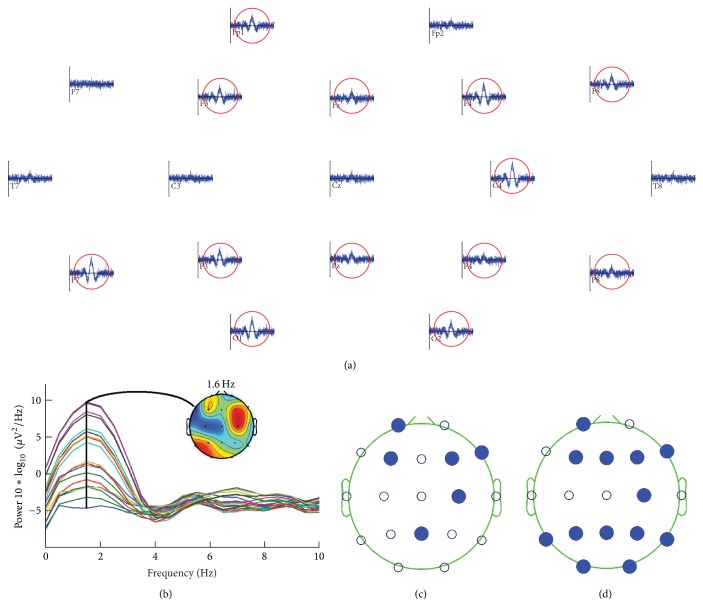
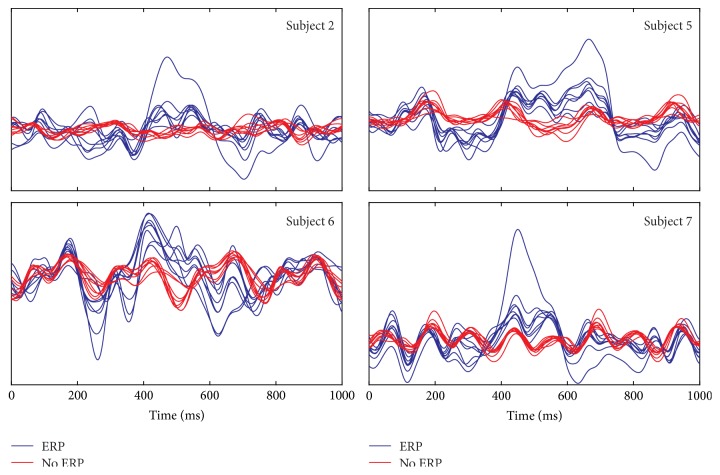
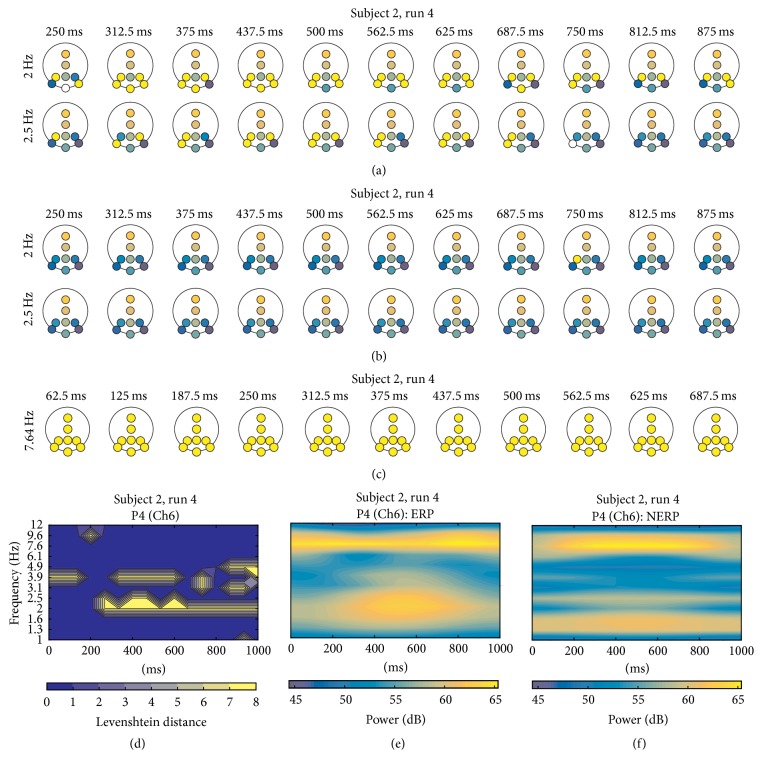
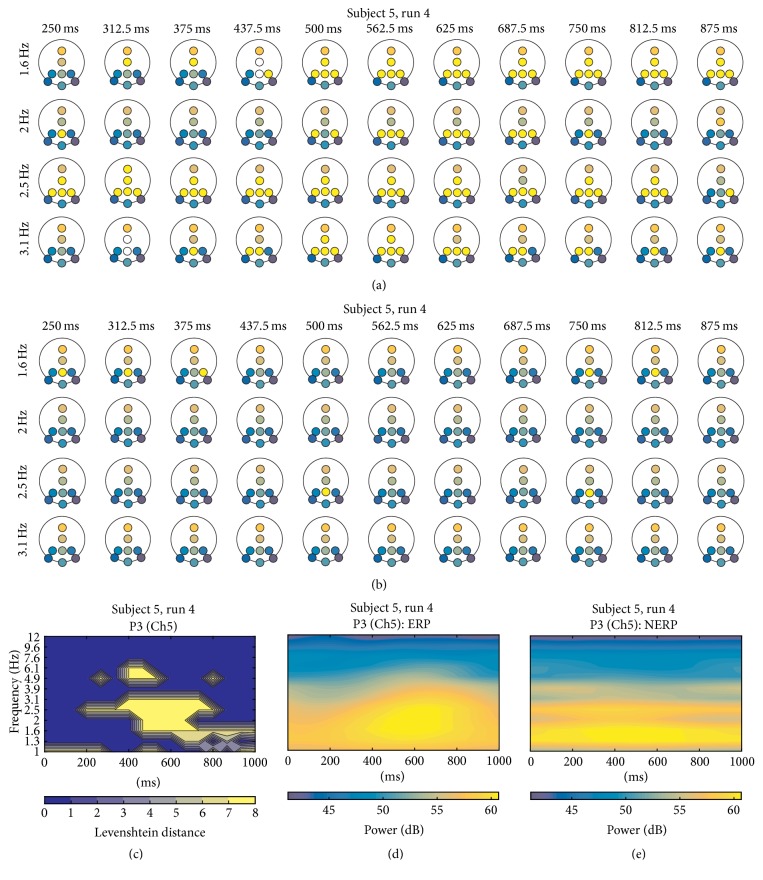
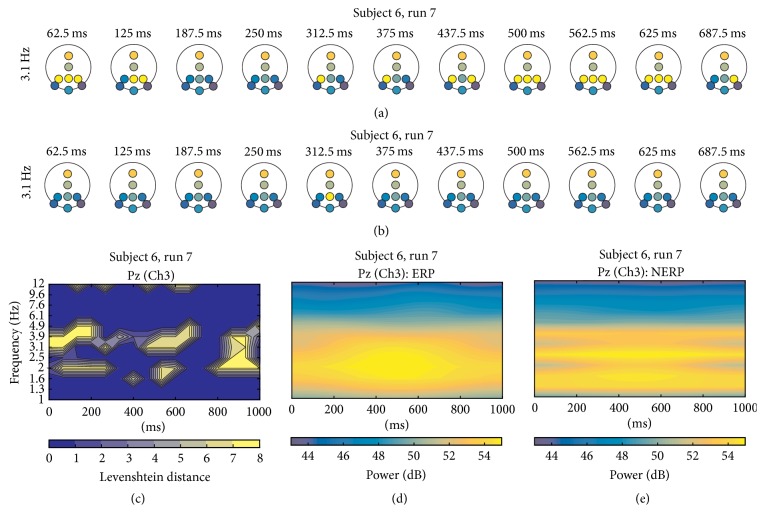
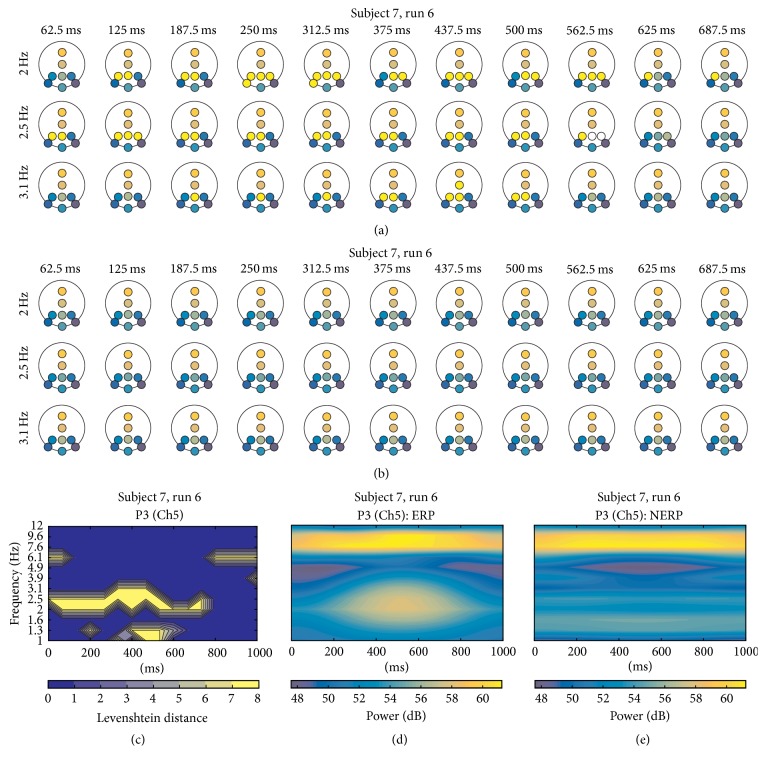
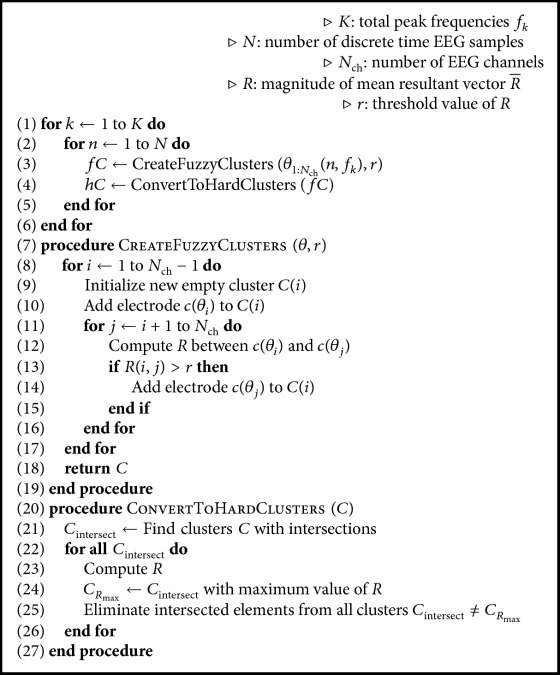
Most EEG phase synchrony measures are of bivariate nature. Those that are multivariate focus on producing global indices of the synchronization state of the system. Thus, better descriptions of spatial and temporal local interactions are still in demand. A framework for characterization of phase synchrony relationships between multivariate neural time series is presented, applied either in a single epoch or over an intertrial assessment, relying on a proposed clustering algorithm, termed Multivariate Time Series Clustering by Phase Synchrony, which generates fuzzy clusters for each multivalued time sample and thereupon obtains hard clusters according to a circular variance threshold; such cluster modes are then depicted in Time-Frequency-Topography representations of synchrony state beyond mere global indices. EEG signals from P300 Speller sessions of four subjects were analyzed, obtaining useful insights of synchrony patterns related to the ERP and even revealing steady-state artifacts at 7.6 Hz. Further, contrast maps of Levenshtein Distance highlight synchrony differences between ERP and no-ERP epochs, mainly at delta and theta bands. The framework, which is not limited to one synchrony measure, allows observing dynamics of phase changes and interactions among channels and can be applied to analyze other cognitive states rather than ERP versus no ERP.
Figures
Similar articles
-
EEG synchrony during a perceptual-cognitive task: widespread phase synchrony at all frequencies.Clin Neurophysiol. 2009 Apr;120(4):695-708. doi: 10.1016/j.clinph.2008.12.044. Epub 2009 Feb 27. Clin Neurophysiol. 2009. PMID: 19250863
-
Frequency flows and the time-frequency dynamics of multivariate phase synchronization in brain signals.Neuroimage. 2006 May 15;31(1):209-27. doi: 10.1016/j.neuroimage.2005.11.021. Epub 2006 Jan 18. Neuroimage. 2006. PMID: 16413209
-
Time-frequency approaches to investigating changes in feedback processing during childhood and adolescence.Psychophysiology. 2018 Oct;55(10):e13208. doi: 10.1111/psyp.13208. Epub 2018 Aug 15. Psychophysiology. 2018. PMID: 30112814 Free PMC article.
-
[On the study methods of electroencephalograph synchronization].Sheng Wu Yi Xue Gong Cheng Xue Za Zhi. 2009 Dec;26(6):1353-7. Sheng Wu Yi Xue Gong Cheng Xue Za Zhi. 2009. PMID: 20095502 Review. Chinese.
-
Recent Trends in Non-invasive Neural Recording Based Brain-to-Brain Synchrony Analysis on Multidisciplinary Human Interactions for Understanding Brain Dynamics: A Systematic Review.Front Comput Neurosci. 2022 Jun 16;16:875282. doi: 10.3389/fncom.2022.875282. eCollection 2022. Front Comput Neurosci. 2022. PMID: 35782087 Free PMC article.
References
-
- Bhattacharya J., Petsche H. Phase synchrony analysis of EEG during music perception reveals changes in functional connectivity due to musical expertise. Signal Processing. 2005;85(11):2161–2177. doi: 10.1016/j.sigpro.2005.07.007. - DOI
MeSH terms
LinkOut - more resources
Full Text Sources
Other Literature Sources
Miscellaneous
