. 2018 Winter;17(1):164-183.

Evaluation of Diabetogenic Mechanism of High Fat Diet in Combination with Arsenic Exposure in Male Mice

Affiliations

Evaluation of Diabetogenic Mechanism of High Fat Diet in Combination with Arsenic Exposure in Male Mice

Akram Ahangarpour et al. Iran J Pharm Res. 2018 Winter.

Abstract

Obesity is a main reason of type 2 diabetes and also chronic exposure to arsenic (As) can produce diabetic symptoms. In previous studies, the association between high-fat diet and arsenic in the incidence of diabetes was found, but the role of beta cells activity, liver mitochondrial oxidative stress, and hepatic enzymes (leptin, adiponectin and beta amylase) was unclear. Thus, present study was conducted to evaluate the diabetogenic mechanism of arsenic followed by concomitant administration of high-fat diet (HFD) in male mice. In this experimental study, the mice consumed with HFD or low-fat diet (LFD) while exposed to As 25 or 50 ppm in drinking water for 20 weeks. At the end of experiments, hyperglycemia, insulin resistance variables, lipid profile, hepatic enzymes, liver mitochondrial oxidative stress, islet insulin secretion, liver, and pancreas histopathology were evaluated in all mice by their own methods. Control HFD fed mice showed a significant increase in FBG, OGTT, HOMA-IR, ITT, lipid profile, leptin, β-amylase, liver mitochondrial oxidative stress, hepatic enzymes and decreased FPI, HOMA-β, adiponectin, and islet insulin secretion or content. However, exposure to HFD concomitant with Arsenic revealed an impressive reduction in FBG, FPI, HOMA-IR, HOMA-β, ITT, lipid profile, and islet insulin secretion or content. This exposure enhanced OGTT, leptin, adiponectin, liver mitochondrial oxidative stress, and hepatic enzymes. In conclusion, HFD and arsenic concomitant administration induced impairment of OGTT and islet insulin secretion or content through the mitochondrial oxidative stress.

Keywords: Arsenic; High-fat diet; Islet insulin secretion; Mitochondrial oxidative stress; Type 2 diabetes.


Figures

Figure 1
Figure 1
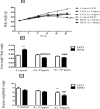
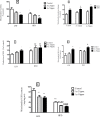
A) Intakes of water, (B) As, (C) food, and (D) calories by control LFD or HFD fed and As 25 or 50 treated LFD or HFD mice. Values represented as mean ± SD (n = 12, for A-D).*: Significantly different from LFD, #: Significantly different from HFD, &: Significantly different from LFD + As 25 ppm, ^: Significantly different from HFD + As 25 ppm, $: Significantly different from LFD + As 50 ppm. *, #, &, ^ and $ p < 0.05, ** and ## p < 0.01, *** and ### p < 0.001
Figure 2
Figure 2
Bodyweight and liver and pancreas weight to body weight ratio in control LFD or HFD fed and As 25 or 50 treated LFD or HFD mice. (A) Body weight. (B) Liver weight to body weight ratio. (C) Pancreas weight to body weight ratio. Values represented as mean ± SD (n = 12, for A-C). *: Significantly different from LFD, #: Significantly different from HFD, &: Significantly different from LFD + As 25 ppm. **, ## and && p < 0.01, *** and ###, p < 0.001
Figure 3
Figure 3
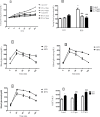
Effects of As exposure on blood glucose and OGTT in control LFD or HFD fed and As 25 or 50 treated LFD or HFD mice. (A) Fasting blood glucose; (B) Fasting blood glucose after 20 weeks (C) OGTT results for control mice (D) OGTT results for mice exposed to As 25 ppm (E) OGTT results for mice exposed to As 50 ppm (F) OGTT AUC, calculated according to OGTT. Values represented as mean ± SD (n = 12, for A-F). *: Significantly different from LFD, #: Significantly different from HFD, &: Significantly different from LFD + As 25 ppm, $: Significantly different from LFD + As50 ppm. **, ## and $$ p < 0.01, ***, ### and &&& p < 0.001
Figure 4
Figure 4
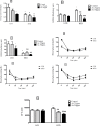
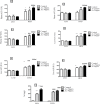
Effects of As exposure on glucose and insulin tolerance in control LFD or HFD fed and As 25 or 50 treated LFD or HFD mice (A) Fasting plasma insulin; (B) HOMA-IR; (C) HOMA-β; (D) ITT results for control mice; (E) ITT results for mice exposed to As 25 ppm; (F) ITT results for mice exposed to As 50 ppm (G) ITT AUC, calculated according to ITT calculated. Values represented as mean ± SD (n = 12, for A-G). *: Significantly different from LFD, #: Significantly different from HFD, &: Significantly different from LFD + As 25 ppm, $: Significantly different from LFD + As 50 ppm. * #, & and $ p < 0.05, **, ##, && and $$ p < 0.01, ### p < 0.001
Figure 5
Figure 5
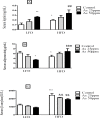
Effect of diet and As exposure on insulin secretion and content of pancreatic islets in control LFD or HFD fed and As 25 or 50 treated LFD or HFD mice (A) Insulin content; (B) Insulin secretion. Values represented as mean ± SD (n = 12, for A-B). *: Significantly different from LFD, #: Significantly different from HFD, &: Significantly different from LFD + As 25 ppm, $: Significantly different from LFD + As 50 ppm. *, #, & and $ p < 0.05
Figure 6
Figure 6
Effects of As and diet on (A) plasma leptin levels; (B) plasma adiponectin levels and (C) plasma β amylase levels in control LFD or HFD fed and As 25 or 50 treated LFD or HFD mice. Values represented as mean ± SD (n = 12, for A-C). *: Significantly different from LFD, #: Significantly different from HFD, &: Significantly different from LFD + As 25 ppm, $: Significantly different from LFD + As 50 ppm. * and # p < 0.05, **, ##, && and $$ p < 0.01, *** p < 0.001
Figure 7
Figure 7
Effects of As and diet on mitochondrial oxidative stress and damage in control LFD or HFD fed and As 25 or 50 treated LFD or HFD mice. (A) Mitochondrial viability; (B) Mitochondrial membrane damage Mitochondrial GSH level; (C) Mitochondrial ROS formation; (D) Mitochondrial MDA level; (E) Mitochondrial GSH level. Values represented as mean ± SD (n = 12, for A-E).*: Significantly different from LFD, #: Significantly different from HFD, &: Significantly different from LFD + As 25 ppm, $: Significantly different from LFD + As 50 ppm. *, #, & and $ p < 0.05, ** p < 0.01, ***, &&& and $$$ p < 0.001
Figure 8
Figure 8
Effects of As and diet on liver and plasma levels of hepatic enzymes and Liver distribution of As in control LFD or HFD fed and As 25 or 50 treated LFD or HFD mice. (A) Plasma ALT; (B) Plasma AST; (C) Plasma ALP; (D) Liver ALT; (E) Liver AST; (F) Liver ALP (G) Liver arsenic distribution. Values represented as mean ± SD (n = 12, for A-E).*: Significantly different from LFD, #: Significantly different from HFD, &: Significantly different from LFD + As 25 ppm, $: Significantly different from LFD + As50 ppm. *, #, and & p < 0.05, **, ## and && p < 0.01, ***, ### and $$$ p < 0.001
Figure 9
Figure 9
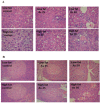
Effects of As and diet on histopathological maps: (A) Pathological maps of liver. (B) Pathological maps of pancreas

References

    1. Liu S, Guo X, Wu B, Yu H, Zhang X, Li M. Arsenic induces diabetic effects through beta-cell dysfunction and increased gluconeogenesis in mice. Sci. Rep. 2014;4:6894–99. - PMC - PubMed
    1. Defronzo RA. Banting Lecture From the triumvirate to the ominous octet: A new paradigm for the treatment of type 2 diabetes mellitus. Diabetes. 2009;58:773–95. - PMC - PubMed
    1. Islam R, Khan I, Hassan SN, McEvoy M, DꞌEste C, Attia J. Association between type 2 diabetes and chronic arsenic exposure in drinking water: A cross sectional study in Bangladesh. Environ. Health. 2012;11:38–47. - PMC - PubMed
    1. Wang W, Xie Z, Lin Y, Zhang D. Association of inorganic arsenic exposure with type 2 diabetes mellitus: A meta-analysis. J. Epidemiol. Community Health. 2014;68:176–84. - PubMed
    1. Wang A, Holladay SD, Wolf DC, Ahmed SA, Robertson JL. Reproductive and developmental toxicity of arsenic in rodents: A review. Int. J. Toxicol. 2006;25:319–31. - PubMed

LinkOut - more resources