. 2018 Jun 1;128(6):2642-2650.
doi: 10.1172/JCI98819. Epub 2018 May 14.

Disease-driving CD4+ T cell clonotypes persist for decades in celiac disease

Affiliations

Disease-driving CD4+ T cell clonotypes persist for decades in celiac disease

Louise F Risnes et al. J Clin Invest. .

Abstract

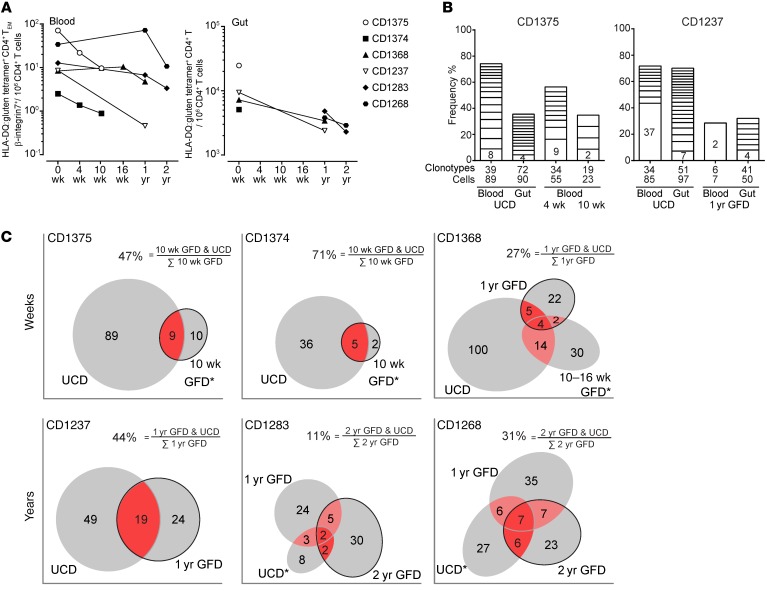
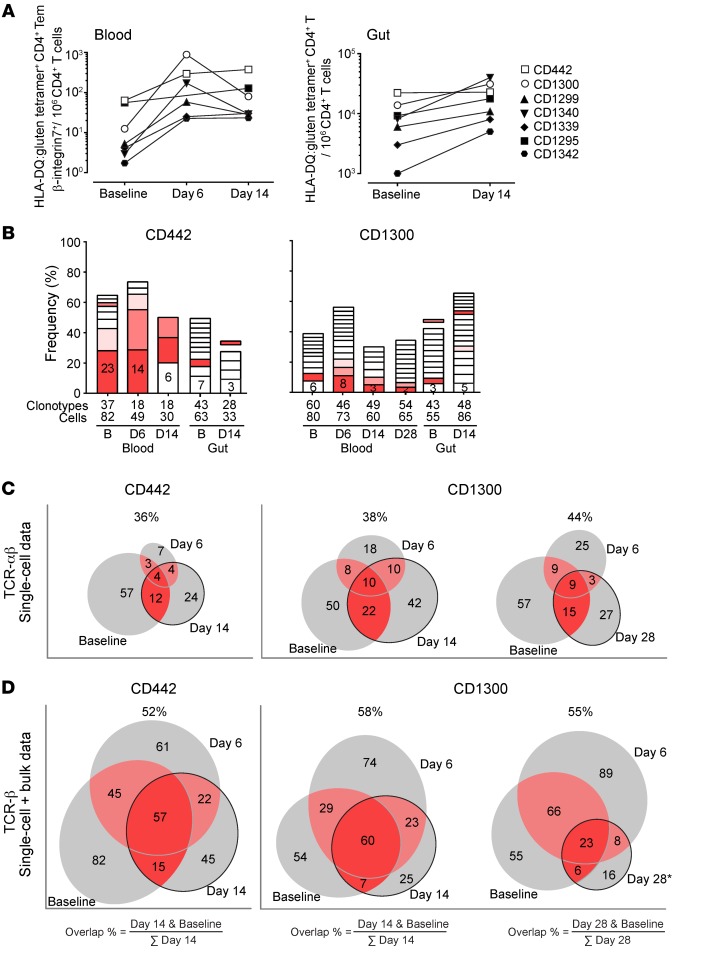
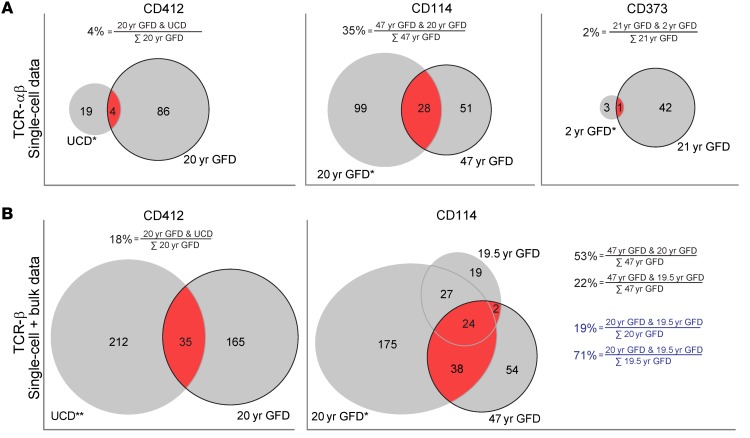
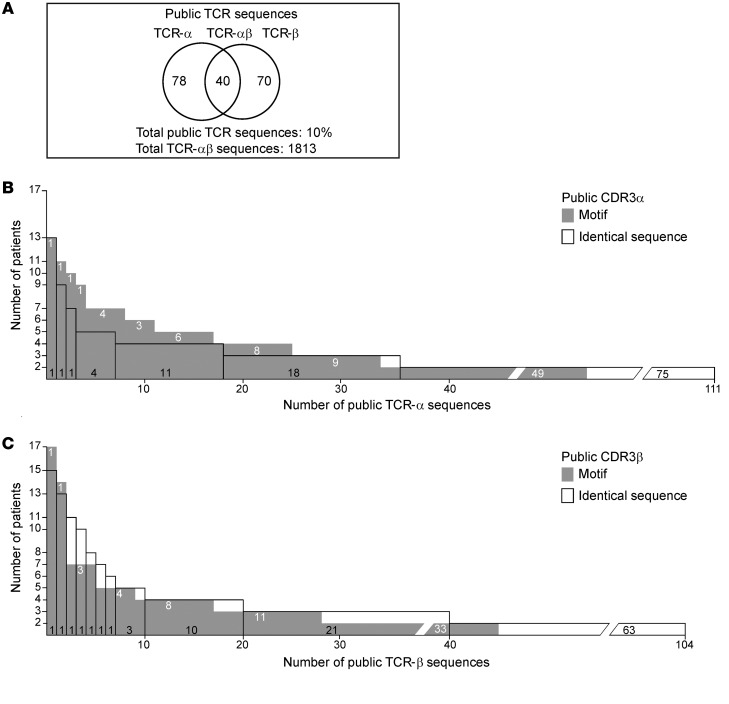
Little is known about the repertoire dynamics and persistence of pathogenic T cells in HLA-associated disorders. In celiac disease, a disorder with a strong association with certain HLA-DQ allotypes, presumed pathogenic T cells can be visualized and isolated with HLA-DQ:gluten tetramers, thereby enabling further characterization. Single and bulk populations of HLA-DQ:gluten tetramer-sorted CD4+ T cells were analyzed by high-throughput DNA sequencing of rearranged TCR-α and -β genes. Blood and gut biopsy samples from 21 celiac disease patients, taken at various stages of disease and in intervals of weeks to decades apart, were examined. Persistence of the same clonotypes was seen in both compartments over decades, with up to 53% overlap between samples obtained 16 to 28 years apart. Further, we observed that the recall response following oral gluten challenge was dominated by preexisting CD4+ T cell clonotypes. Public features were frequent among gluten-specific T cells, as 10% of TCR-α, TCR-β, or paired TCR-αβ amino acid sequences of total 1813 TCRs generated from 17 patients were observed in 2 or more patients. In established celiac disease, the T cell clonotypes that recognize gluten are persistent for decades, making up fixed repertoires that prevalently exhibit public features. These T cells represent an attractive therapeutic target.

Keywords: Autoimmunity; Immunology; T cells; T-cell receptor.


Conflict of interest statement

Conflict of interest: LMS, SWQ, KEAL, LFR, AC, SDK, RSN and GKS have filed a patent application (GB 1804724.1) on the use of the gluten-specific public T cell receptor sequences described in the current work for diagnosis of celiac disease. LMS, SWQ, AC, and KEAL are holders of a patent application on the detection of gluten-specific T cells by HLA-DQ:gluten tetramers (EP20140789602). KEAL is an advisor to ImmusanT and Bioniz Therapeutics. LMS is an advisor to ImmusanT and Bioniz Therapeutics and is a consultant to Celgene and Intrexon. Regeneron Pharmaceuticals and ImmusanT have provided research grants to the research group of LMS.

Figures

Figure 1
Figure 1. The number of circulating gluten-specific T cells decreases after commencement of GFD, and the T cell repertoires overlap in samples taken weeks or years apart.
(A) Frequency of gut-homing effector-memory CD4+ T cells binding to a pool of HLA-DQ:gluten tetramers in blood and gut samples taken from 6 patients during the first weeks and 1 to 2 years after commencement of GFD. (B) Distribution of TCR-αβ clonotypes obtained by single-cell TCR sequencing of gluten-specific T cells from 2 patients with the most available TCR data. Data from the remaining 4 patients are shown in Supplemental Figure 3A. Clonotypes observed in at least 2 cells are plotted as stacked boxes in the percentage of the total number of cells. The clonal size of the most dominant clonotype is displayed as a number. The total numbers of clonotypes and cells in each sample are shown below each stacked bar. (C) Area-proportional Venn diagrams of TCR-αβ clonotypes obtained by single-cell sequencing at various time points after commencement of GFD. The patients indicated in the top panels were followed for 10 weeks up to 1 year, whereas the patients indicated in the lower panels were followed for 1 to 2 years after commencement of GFD. The dark red areas represent clonotypes that were observed both at the latest time points and when the patients were untreated. The percentages denote the proportion of these shared clonotypes (dark red areas) at the latest time point (black border). The remaining clonotype overlaps are marked in light red. Asterisks indicate that data were obtained from blood sample only.
Figure 2
Figure 2. Preexisting T cell clonotypes expand and dominate during and after gluten-challenge response.
(A) Frequency of CD4+ T cells binding to a pool of HLA-DQ:gluten tetramers in blood and duodenal biopsy samples from 7 patients during gluten challenge. Tem, effector-memory T cells. (B) Distribution of TCR-αβ clonotypes obtained by single-cell TCR sequencing of tetramer-binding T cells from the 2 patients who showed the most response. Data from the remaining 5 patients are shown in Supplemental Figure 3C and Supplemental Figure 4. The x axes denote the sampling time points baseline before challenge (B) and day 6 (D6), day 14, and day 28 after the initiation of gluten challenge. The y axes show the percentage share of each clonotype represented as stacked boxes. Only clonotypes observed in at least 2 cells are plotted, and the most dominant clonotypes are displayed as numbers within the boxes. The colored boxes represent the 3 most dominant clonotypes at day 6 that were also observed at other time points. The isolated and nonstacked colored boxes represent shared clonotypes with clonal size 1. The total numbers of clonotypes and cells in each sample are shown below each stacked bar. Reoccurrence of identical TCR clonotypes in different samples from patients CD1300 and CD442 is depicted in area-proportional Venn diagrams (C and D). (C) TCR-αβ clonotype data obtained by single-cell sequencing. (D) TCR-β clonotype data compiled from both single-cell and bulk sequencing. The dark red areas represent clonotypes that were observed both at baseline and at the latest time point. The percentages denote the proportion of these shared clonotypes (dark red areas) at the latest time points (black border). The light red areas represent all other clonotype overlaps. Asterisks show only single-cell data for day 28.
Figure 3
Figure 3. T cell clonotypes persist in gut tissue and blood for decades.
Gluten-specific TCR clonotypes observed at various time points in years after commencement of GFD from patients CD412, CD114, and CD373 are depicted in area-proportional Venn diagrams. (A and B) Single-cell data (TCR-αβ) and combined single-cell and bulk sequencing data (TCR-β), respectively. The dark red areas represent clonotypes that were observed both at the latest time point and when the patient was untreated (CD412) or in the earliest samples we had access to (19.5-year or 20-year GFD for CD114; 2-year GFD for CD373). The percentage (black font) denotes the proportion of shared clonotypes (dark red areas) at the latest time point (black border). For CD114, the proportion of shared clonotypes at 19.5-year GFD and 20-year GFD is also shown (blue font). Asterisks show data obtained from blood sample only. Double asterisks show data obtained from TCL generated from single biopsy.
Figure 4
Figure 4. Public TCR sequences amount to 10% of the gluten-specific T cell repertoire.
(A) Number of public TCRs defined as identical TCR-α, TCR-β, or paired TCR-αβ amino acid sequences observed in at least 2 individuals in a data set of a total of 1,813 gluten-specific TCR amino acid sequences from 17 HLA-DQ2.5+ patients. (B and C) Number of public TCR-α and TCR-β sequences, respectively, that were found in the number of patients plotted on the y axes. The open bars show public TCR-α or TCR-β sequences defined as identical amino acid sequences, whereas gray bars show semipublic TCR-α and TCR-β motifs generated by collapsing TCR-α or TCR-β amino acid sequences that differ by 3 residues or less.

Comment in

References

    1. Nepom GT. Class II antigens and disease susceptibility. Annu Rev Med. 1995;46:17–25. doi: 10.1146/annurev.med.46.1.17. - DOI - PubMed
    1. Thorsby E. Invited anniversary review: HLA associated diseases. Hum Immunol. 1997;53(1):1–11. doi: 10.1016/S0198-8859(97)00024-4. - DOI - PubMed
    1. Joachims ML, et al. Single-cell analysis of glandular T cell receptors in Sjögren’s syndrome. JCI Insight. 2016;1(8):e85609. - PMC - PubMed
    1. Emerson RO, et al. Immunosequencing identifies signatures of cytomegalovirus exposure history and HLA-mediated effects on the T cell repertoire. Nat Genet. 2017;49(5):659–665. doi: 10.1038/ng.3822. - DOI - PubMed
    1. Michels AW, et al. Islet-Derived CD4 T Cells Targeting Proinsulin in Human Autoimmune Diabetes. Diabetes. 2017;66(3):722–734. doi: 10.2337/db16-1025. - DOI - PMC - PubMed

Publication types