. 2018 Jul;104(1):185-193.
doi: 10.1002/JLB.1MA1117-444R. Epub 2018 May 14.

Reuse of public, genome-wide, murine eosinophil expression data for hypotheses development

Affiliations

Reuse of public, genome-wide, murine eosinophil expression data for hypotheses development

Jillian O Grace et al. J Leukoc Biol. 2018 Jul.

Abstract

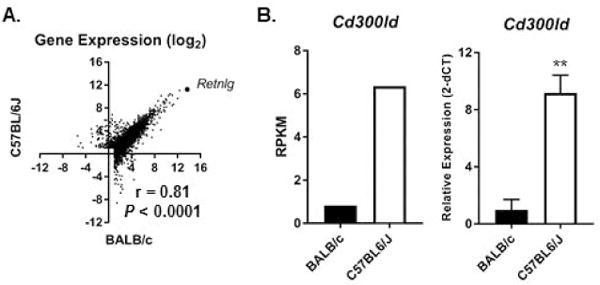
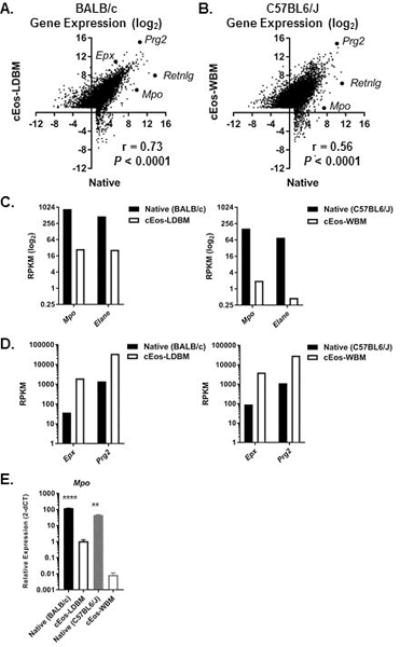
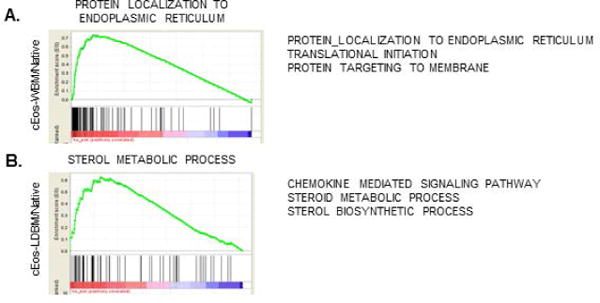
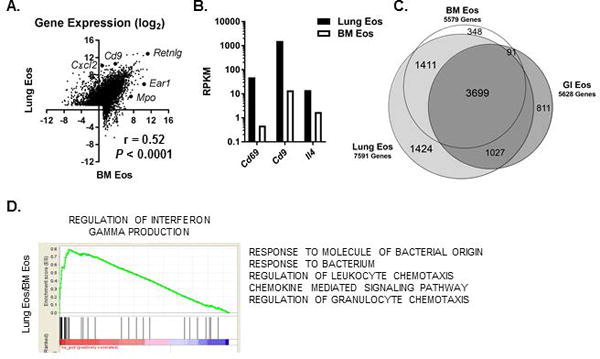
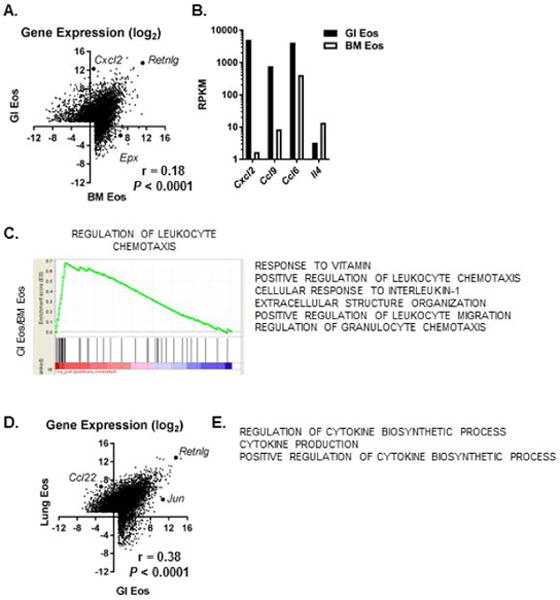
The eosinophil (Eos) surface phenotype and activation state is altered after recruitment into tissues and after exposure to pro-inflammatory cytokines. In addition, distinct Eos functional subsets have been described, suggesting that tissue-specific responses for Eos contribute to organ homeostasis. Understanding the mechanisms by which Eos subsets achieve their tissue-specific identity is currently an unmet goal for the eosinophil research community. Publicly archived expression data can be used to answer original questions, test and generate new hypotheses, and serve as a launching point for experimental design. With these goals in mind, we investigated the effect of genetic background, culture methods, and tissue residency on murine Eos gene expression using publicly available, genome-wide expression data. Eos differentiated from cultures have a gene expression profile that is distinct from that of native homeostatic Eos; thus, researchers can repurpose published expression data to aid in selecting the appropriate culture method to study their gene of interest. In addition, we identified Eos lung- and gastrointestinal-specific transcriptomes, highlighting the profound effect of local tissue environment on gene expression in a terminally differentiated granulocyte even at homeostasis. Expanding the "toolbox" of Eos researchers to include public-data reuse can reduce redundancy, increase research efficiency, and lead to new biological insights.

Keywords: allergy; gene regulation; mucosal immunology.


Conflict of interest statement

Conflict of Interest Disclosure

P.C. Fulkerson has received grants from the National Institutes of Health, has served as a consultant for Genentech, Inc. and has received research funding from Knopp Biosciences, LLC. The remaining authors declare no relevant conflicts of interest.

Figures

Figure 1
Figure 1. Genetic variation has little effect on Eos transcriptome
(A) Scatter plot comparing gene expression (log2 mean RPKM) in native Eos sorted from the bone marrow of C57BL6/J (GSE110299) and BALB/c (GSE69707) mice is shown. The gene Retnlg with similar expression in both strains and Spearman correlation are shown. (B) Expression levels (mean RPKM in left panel from RNA-seq and normalized relative gene expression [mean ± SEM, representative of 2 experiments] from qPCR in right panel) of Cd300ld in native Eos from the bone marrow at homeostasis are shown. **P < 0.01.
Figure 2
Figure 2. Gene expression in culture-differentiated Eos (cEos) differs from that of native Eos
(A-B) Scatter plots comparing gene expression (log2 mean RPKM) between native Eos (GSE69707) and Eos cultured from low-density (cEos-LDBM, GSE43660) or unselected whole (cEos-WBM, GSE55385) bone marrow cells and Spearman correlation are shown. Representative genes are labeled in the plots. (C-D) Expression levels (mean RPKM) of Mpo, Elane, Epx and Prg2 in native Eos and cEos are shown. (E) Normalized relative expression level (mean ± SEM) in native Eos and cEos are shown. **P < 0.01, ****P < 0.0001, comparing strain-specific native to cEos.
Figure 3
Figure 3. Gene ontology analysis of differentially expressed genes between cEos and native Eos
Representative enrichment plots for gene set enrichment analysis results comparing native Eos with cEos-WBM (C57BL6/J) (A) or cEos-LDBM (BALB/c) (B) are shown. The red-blue scale represents list of all expressed genes ranked by expression fold change between cEos and native Eos from highest (red) to lowest (blue) fold change in expression [27]. Genes included in the biological pathway set are represented as black vertical lines along the bottom. The enrichment score (green) is calculated by going along the ranked list so that the score increases if the gene is a part of the pathway set and decreases if the gene is not. A list of selected enriched pathways with a normalized enrichment score ≥ 2.0 are also shown.
Figure 4
Figure 4. Lung-resident Eos have markedly different transcriptomes than do native Eos
(A) Scatter plot comparing gene expression (log2 mean RPKM) between lung (Lung, GSE56292) and bone marrow (BM, GSE110299) Eos at homeostasis and Spearman correlation are shown. (B) Expression level (mean RPKM) of representative genes that are expressed higher in Lung Eos than BM Eos are shown. (C) Venn diagram with overlap of homeostatic gene expression between Lung Eos (light gray), BM Eos (white) and Eos sorted from the gastrointestinal tract (dark gray, GI Eos, GSE106213) is shown. (D) Representative enrichment plot for gene set enrichment analysis results comparing Lung Eos and BM Eos are shown. A list of enriched pathways with higher expression in Lung Eos and a normalized enrichment score ≥ 2.2 are also shown.
Figure 5
Figure 5. Gastrointestinal resident Eos have markedly different transcriptomes than BM and Lung Eos
(A) Scatter plot comparing gene expression (log2 mean RPKM) between gastrointestinal (GI, GSE106213) and bone marrow (BM, GSE110299) Eos at homeostasis and Spearman correlation are shown. (B) Expression level (mean RPKM) of representative genes are shown. (C) Representative enrichment plot for gene set enrichment analysis results comparing GI Eos and BM Eos are shown. A list of enriched pathways with higher expression in GI Eos and a normalized enrichment score ≥ 2.1 are also shown. (D) Scatter plot comparing gene expression (log2 mean RPKM) between GI and Lung Eos (GSE56292) at homeostasis and Spearman correlation are shown. (E) A list of enriched pathways with higher expression in Lung Eos than GI Eos and a normalized enrichment score ≥ 2.0 is shown.

References

    1. Marichal T, Mesnil C, Bureau F. Homeostatic Eosinophils: Characteristics and Functions. Front Med (Lausanne) 2017;4:101. - PMC - PubMed
    1. Jacobsen EA, Helmers RA, Lee JJ, Lee NA. The expanding role(s) of eosinophils in health and disease. Blood. 2012;120:3882–90. - PMC - PubMed
    1. Rosenberg HF, Dyer KD, Foster PS. Eosinophils: changing perspectives in health and disease. Nature reviews. Immunology. 2013;13:9–22. - PMC - PubMed
    1. Na HJ, Hamilton RG, Klion AD, Bochner BS. Biomarkers of eosinophil involvement in allergic and eosinophilic diseases: review of phenotypic and serum markers including a novel assay to quantify levels of soluble Siglec-8. Journal of immunological methods. 2012;383:39–46. - PMC - PubMed
    1. Johansson MW. Activation states of blood eosinophils in asthma. Clinical and experimental allergy : journal of the British Society for Allergy and Clinical Immunology. 2014;44:482–98. - PMC - PubMed

Publication types