

High-throughput discovery of functional disordered regions: investigation of transactivation domains
- PMID: 29759983
- PMCID: PMC5949888
- DOI: 10.15252/msb.20188190
High-throughput discovery of functional disordered regions: investigation of transactivation domains
Abstract
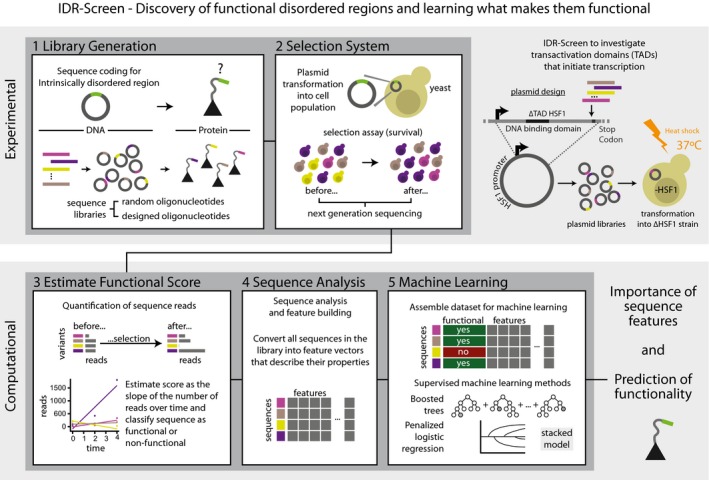
Over 40% of proteins in any eukaryotic genome encode intrinsically disordered regions (IDRs) that do not adopt defined tertiary structures. Certain IDRs perform critical functions, but discovering them is non-trivial as the biological context determines their function. We present IDR-Screen, a framework to discover functional IDRs in a high-throughput manner by simultaneously assaying large numbers of DNA sequences that code for short disordered sequences. Functionality-conferring patterns in their protein sequence are inferred through statistical learning. Using yeast HSF1 transcription factor-based assay, we discovered IDRs that function as transactivation domains (TADs) by screening a random sequence library and a designed library consisting of variants of 13 diverse TADs. Using machine learning, we find that segments devoid of positively charged residues but with redundant short sequence patterns of negatively charged and aromatic residues are a generic feature for TAD functionality. We anticipate that investigating defined sequence libraries using IDR-Screen for specific functions can facilitate discovering novel and functional regions of the disordered proteome as well as understand the impact of natural and disease variants in disordered segments.
Keywords: high‐throughput screen; intrinsically disordered protein; machine learning; mutational scanning; transactivation domain.
© 2018 MRC Laboratory of Molecular Biology. Published under the terms of the CC BY 4.0 license.
Figures
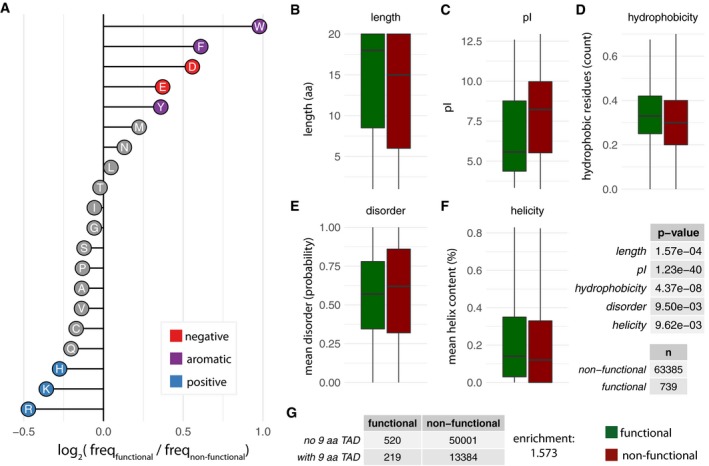
- A
Enrichment and depletion of different amino acids in the random library (log2 of frequencies of functional over non‐functional sequences).
- B–G
Boxplots of the distribution of the values of length (B), pI (C), hydrophobicity (D), disorder content (E), and helicity (F) for sequences that are functional (green) and non‐functional (red). In the boxplots, the central line shows the median. Statistical significance was assessed using Wilcoxon test, n values (sample size) and P‐values are provided on the right. (G) Enrichment of 9‐aa TAD motif in functional versus non‐function sequences; ratio of with‐to‐without 9‐aa TAD in functional‐to‐non‐functional sequences (219/520)/(13384/50001).
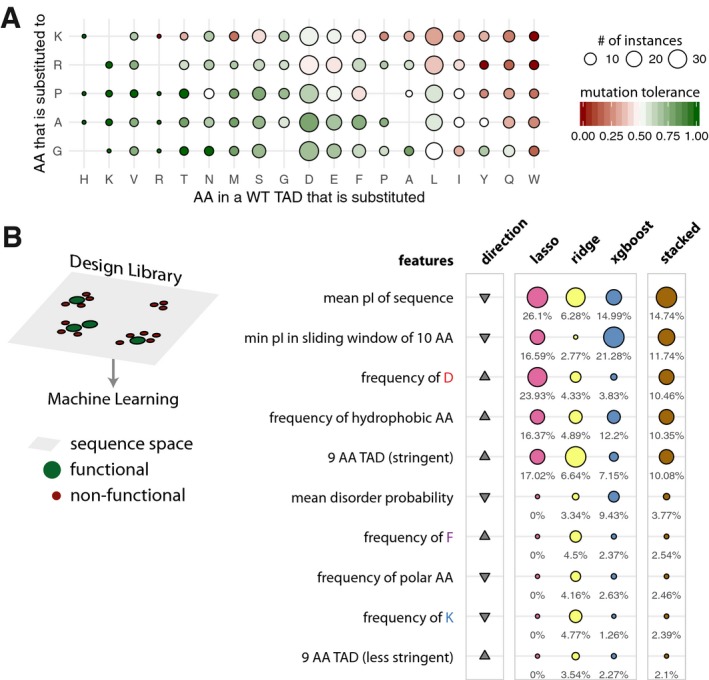
Heatmap of the tolerance to amino acid substitutions in WT transactivation domain sequences. The tolerance of a mutation is defined as the fraction of functional sequences over all the sequences when a specific substitution was performed. The columns (amino acid in a WT TAD that is substituted) are ordered according to decreasing tolerance (from left to right), and the rows (amino acid into which a residue in the WT TAD is substituted for) are ordered according to decreasing tolerance (from bottom to top). The cells are colored on a green to red gradient for high to low tolerance, respectively. Empty tiles represent data points not detected in the library.
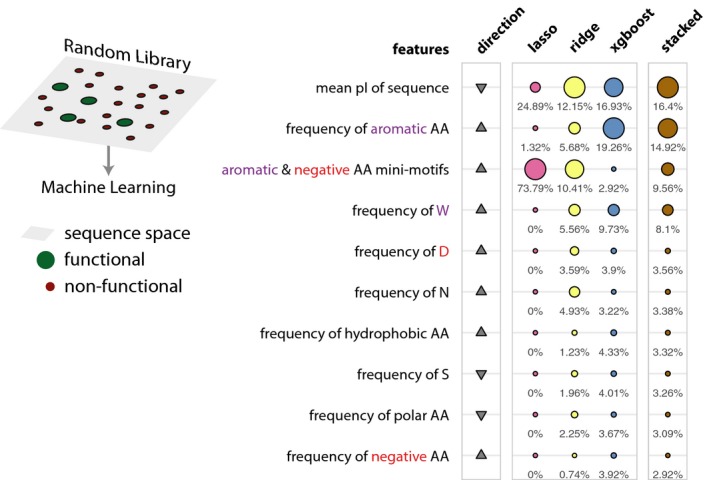
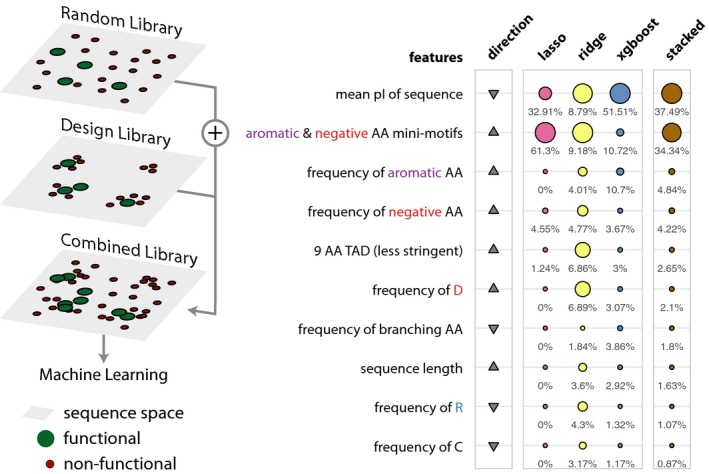
Schematic describing the sequence space explored by the design library (left). Table listing the top 10 most important features. The relative feature importance is given as relative percentages in the last four columns. The size of the circles is scaled per method (lasso, ridge, xgboost, stacked). The direction column denotes the direction of enrichment of the given feature for functional sequences compared to non‐functional sequences (up, positive direction and down, negative direction). This figure provides a simplified description of the actual features, which are available in Table EV7.
Comment in
-
High-throughput discovery of functional disordered regions.Mol Syst Biol. 2018 May 22;14(5):e8377. doi: 10.15252/msb.20188377. Mol Syst Biol. 2018. PMID: 29789308 Free PMC article.
References
-
- Anfinsen CB (1973) Principles that govern the folding of protein chains. Science 181: 223–230 - PubMed
-
- Betts MJ, Russell RB (2003) Amino acid properties and consequences of substitutions In Bioinformatics for geneticists: a bioinformatics primer for the analysis of genetic data, Barnes MR. (ed.), 2nd edn, pp. 311–342. Hoboken, NJ: Wiley;
Publication types
MeSH terms
Substances
Grants and funding
LinkOut - more resources
Full Text Sources
Other Literature Sources
Molecular Biology Databases
