. 2018 Jul 1;78(13):3445-3457.
doi: 10.1158/0008-5472.CAN-17-2928. Epub 2018 May 14.

GFPT2-Expressing Cancer-Associated Fibroblasts Mediate Metabolic Reprogramming in Human Lung Adenocarcinoma

Affiliations

GFPT2-Expressing Cancer-Associated Fibroblasts Mediate Metabolic Reprogramming in Human Lung Adenocarcinoma

Weiruo Zhang et al. Cancer Res. .

Abstract

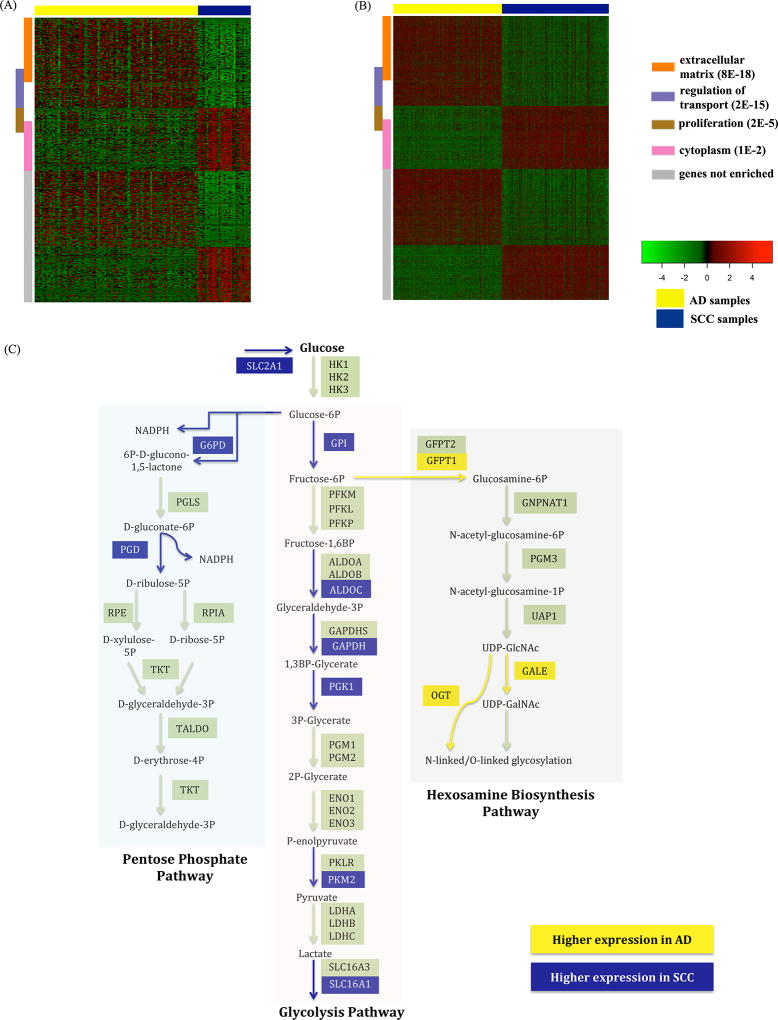
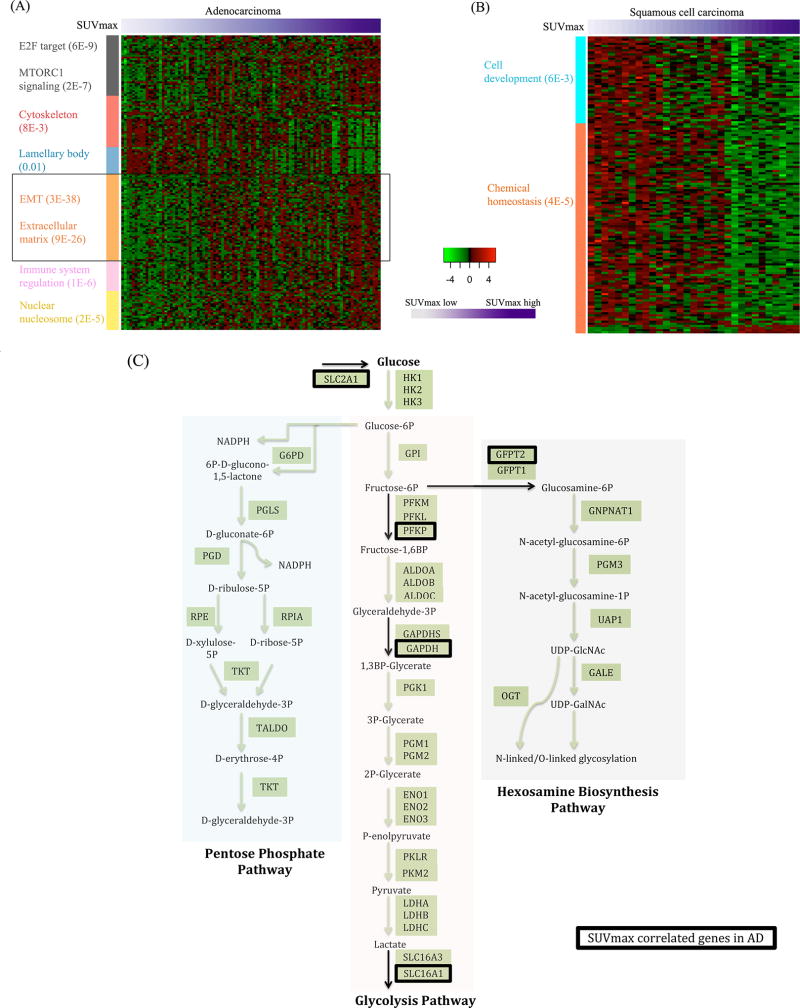
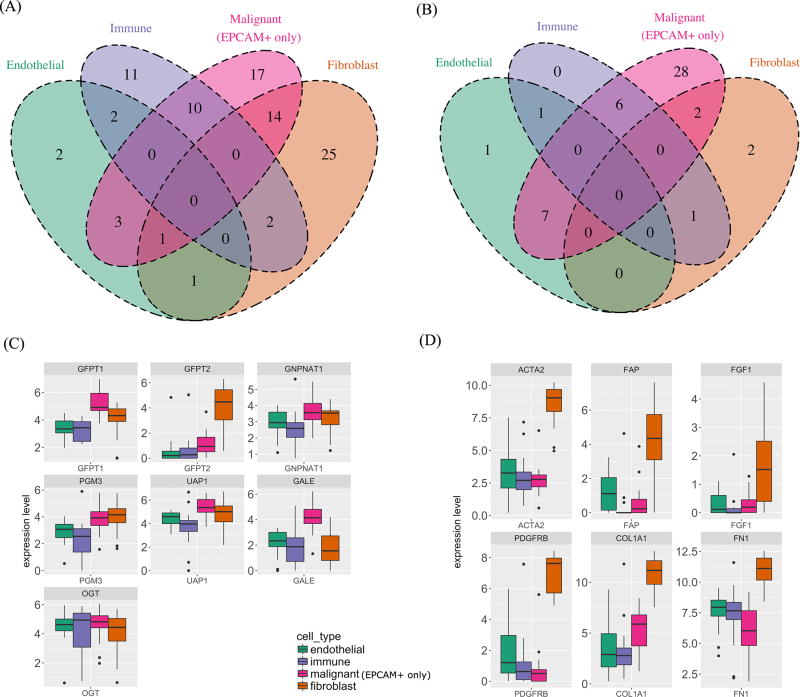
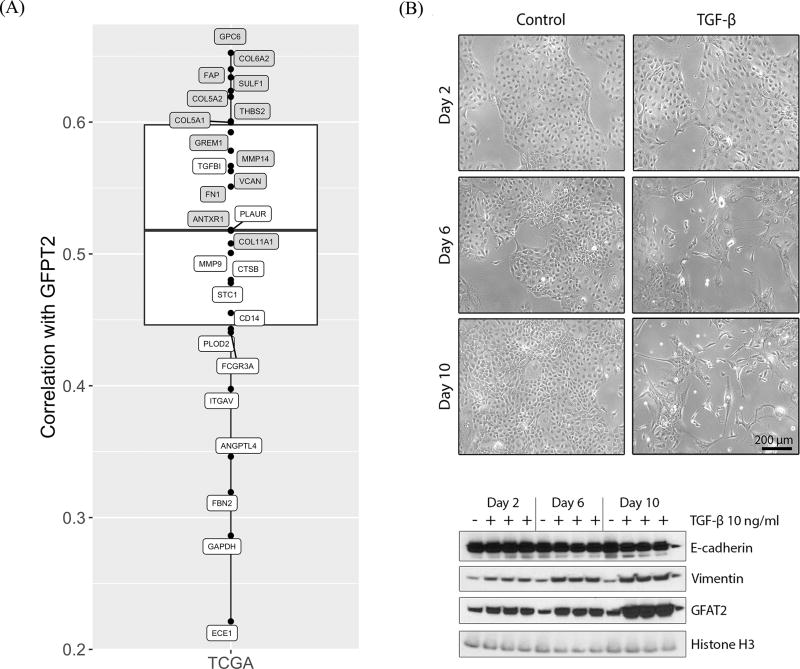
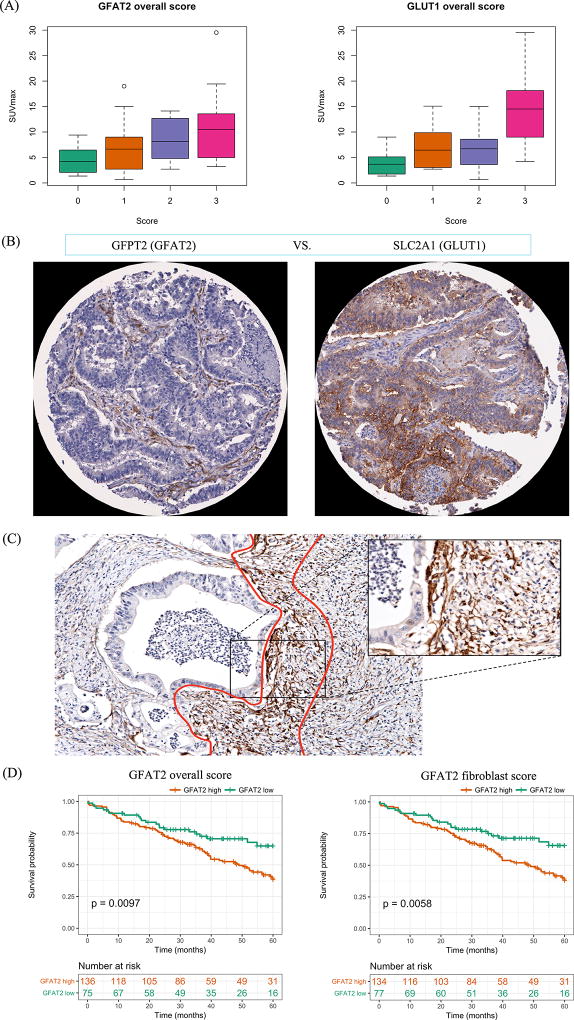
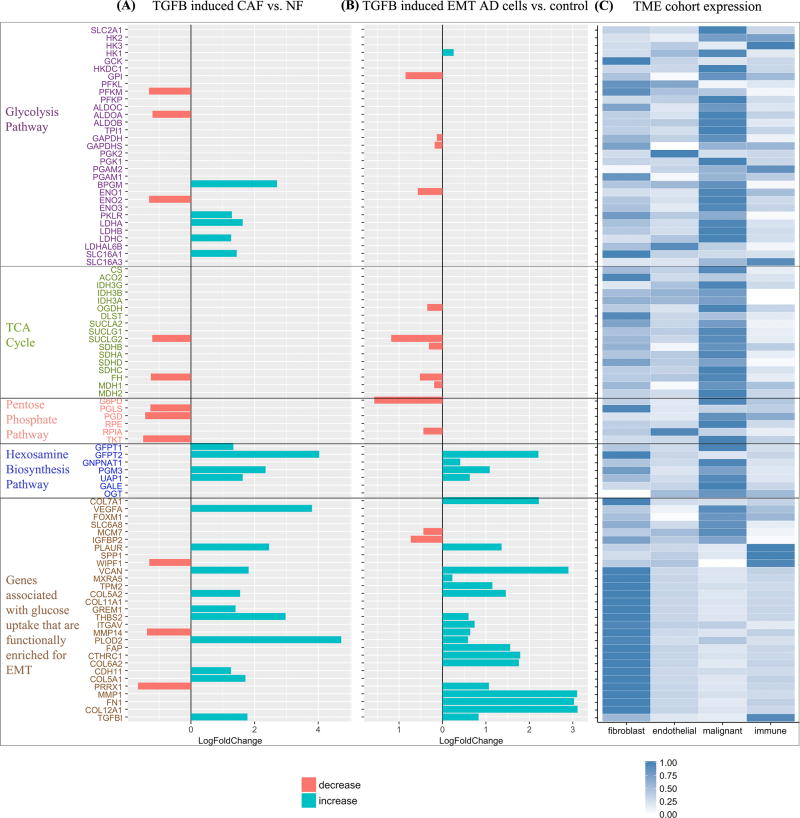
Metabolic reprogramming of the tumor microenvironment is recognized as a cancer hallmark. To identify new molecular processes associated with tumor metabolism, we analyzed the transcriptome of bulk and flow-sorted human primary non-small cell lung cancer (NSCLC) together with 18FDG-PET scans, which provide a clinical measure of glucose uptake. Tumors with higher glucose uptake were functionally enriched for molecular processes associated with invasion in adenocarcinoma and cell growth in squamous cell carcinoma (SCC). Next, we identified genes correlated to glucose uptake that were predominately overexpressed in a single cell-type comprising the tumor microenvironment. For SCC, most of these genes were expressed by malignant cells, whereas in adenocarcinoma, they were predominately expressed by stromal cells, particularly cancer-associated fibroblasts (CAF). Among these adenocarcinoma genes correlated to glucose uptake, we focused on glutamine-fructose-6-phosphate transaminase 2 (GFPT2), which codes for the glutamine-fructose-6-phosphate aminotransferase 2 (GFAT2), a rate-limiting enzyme of the hexosamine biosynthesis pathway (HBP), which is responsible for glycosylation. GFPT2 was predictive of glucose uptake independent of GLUT1, the primary glucose transporter, and was prognostically significant at both gene and protein level. We confirmed that normal fibroblasts transformed to CAF-like cells, following TGFβ treatment, upregulated HBP genes, including GFPT2, with less change in genes driving glycolysis, pentose phosphate pathway, and TCA cycle. Our work provides new evidence of histology-specific tumor stromal properties associated with glucose uptake in NSCLC and identifies GFPT2 as a critical regulator of tumor metabolic reprogramming in adenocarcinoma.Significance: These findings implicate the hexosamine biosynthesis pathway as a potential new therapeutic target in lung adenocarcinoma. Cancer Res; 78(13); 3445-57. ©2018 AACR.


Conflict of interest statement

Competing interests: The authors declare no potential conflicts of interest.

Figures

Figure 1
Figure 1
Differentially expressed genes (DEGs) between AD and SCC. (A) Heatmap of DEGs between AD and SCC in the radiogenomics (RG) cohort. (B) Heatmap for TCGA showing only the DEGs derived from the radiogenomics cohort. Yellow denotes AD, and Blue denotes SCC samples. DEGs are annotated for enrichment of extracellular matrix (coral), regulation of transport related to invasion (lavender), proliferation (brown), cytoplasm (pink), or unassigned (grey). The enrichment FDRs are shown in parenthesis. (C) Glucose-driven metabolic pathways: glycolysis, pentose phosphate pathway and hexosamine biosynthesis pathway. All DEGs in the glucose metabolic pathways were differentially expressed in both RG cohort and TCGA, except for G6PD and PKM2 which were only differentially expressed in TCGA, and OGT which was only differentially expressed in the RG cohort.
Figure 2
Figure 2
Heatmap of SUVmax correlated genes in Adenocarcinomas (A) and Squamous cell carcinomas (B) in the radiogenomics (RG) cohort. FDRs for functional enrichment are indicated in parenthesis. Patients (columns) are sorted from low SUVmax to high SUVmax. (C) Glucose metabolism genes that are correlated to glucose uptake in AD samples in the RG cohort.
Figure 3
Figure 3
Analysis of genes associated with glucose metabolic reprogramming in the tumor microenvironment. (A) For AD, genes correlated with glucose uptake are placed on Venn diagram by cell-type-specific expression (derived from TME cohort), showing the largest number of uniquely expressed genes are in fibroblasts. (B) For SCC, genes correlated with glucose uptake are placed on Venn diagram by cell-type-specific expression (derived from TME cohort), showing the largest number of uniquely expressed genes are in the malignant cells, with few genes expressed in other cell-types. (C) Expression of HBP genes in the four cell-types (TME cohort, AD samples), showing fibroblasts and malignant cells have higher expression of HBP genes than immune and endothelial cells. (D) Expression of common CAF marker genes in the four cell types in the (TME cohort, AD samples), confirming the expected behavior of the CAF subpopulation.
Figure 4
Figure 4
Validation of association of GFPT2 and SUVmax-associated secreted glycoproteins and EMT. (A) Correlation between GFPT2 and glycoprotein-coding genes correlated with glucose uptake in TCGA AD. Genes highlighted in gray were more expressed in CAFs compared to other cells in our TME cohort; these genes are among highest correlated. (B) Morphological and protein expression changes in HCC827 cells after EMT induction with TGF-β treatment. (Top) Phase-contrast microscopy showing HCC827 cells after treatment with, or without (control), TGF-β (10 ng/ml) up to 10 days. All images were obtained at a magnification of 100×. Scale bar represents 200 μm. (Bottom) Following TGF-β treatment on HCC827, protein lysates were harvested at the indicated time points and E-cadherin, Vimentin and Glutamine fructose-6-phosphate amidotransferase 2 (GFAT2: protein coded by GFPT2 gene) were analyzed by Western blot. Histone H3 was used an internal loading control. During the EMT time course, Vimentin increased, E-cadherin decreased and GFAT2 increased.
Figure 5
Figure 5
Validation of the correlation between GFPT2 and SUVmax in TMA cohort and survival analysis based on GFAT2 protein. (A) Statistically significant correlation between GFAT2 (coded by GFPT2 gene) and GLUT1 (SLC2A1) with SUVmax (GFAT2 p-value: 0.003, GLUT1 p-value: 0.005). (B) Representative sample from TMA of paired GFAT2 and GLUT1 expression, illustrating GFAT2 expression localization to fibroblasts and simultaneous GLUT1 expression localization to malignant cells. (C) Representative whole slide microphotograph of GFAT2 expression showing GFAT2 enriched in cancer-associated fibroblasts at tumor periphery. (D) GFAT2 staining overall and fibroblast scores were both prognostic for 5-year survival in TMA adenocarcinoma patients. Overall score: p-value=0.0097, HR=1.86, CI=[1.15, 2.99]. Fibroblast score: p-value=0.0058, HR=2.05, CI=[1.20, 3.11].
Figure 6
Figure 6
Glucose metabolism related genes and genes associated with glucose uptake that are functionally enriched for EMT in the validation cell line data and TME cohort. (A) TGF-β induced cancer-associated fibroblast (CAF) compared to normal fibroblast (NF) (GSE60880). (B) AD cell lines with TGF-β induced EMT compared to AD cell lines without TGF-β treatment (control) (GSE49644). (C) Heatmap of normalized average expression of the genes in each of the four cell types in the TME cohort AD samples.

References

    1. Warburg O. The metabolism of carcinoma cells. J Cancer Res. 1925;9(1):148–163.
    1. Ward PS, Thompson CB. Metabolic reprogramming: A cancer hallmark even Warburg did not anticipate. Cancer Cell. 2012;21(3):297–308. - PMC - PubMed
    1. Hanahan D, Weinberg RA. Hallmarks of cancer: The next generation. Cell. 2011;144(5):646–674. - PubMed
    1. Zhang B, Zheng A, Hydbring P, Ambroise G, Ouchida AT, Goiny M, et al. PHGDH defines a metabolic subtype in lung adenocarcinomas with poor prognosis. Cell Reports. 2017;19(11):2289–2303. - PubMed
    1. Hensley CT, Faubert B, Yuan Q, Lev-Cohain N, Jin E, Kim J, et al. Metabolic heterogeneity in human lung tumors. Cell. 2016;164(4):681–694. - PMC - PubMed

Publication types

MeSH terms

Substances