. 2018 May 29;115(22):5774-5779.
doi: 10.1073/pnas.1716552115. Epub 2018 May 14.

Spatial mutation patterns as markers of early colorectal tumor cell mobility

Affiliations

Spatial mutation patterns as markers of early colorectal tumor cell mobility

Marc D Ryser et al. Proc Natl Acad Sci U S A. .

Abstract

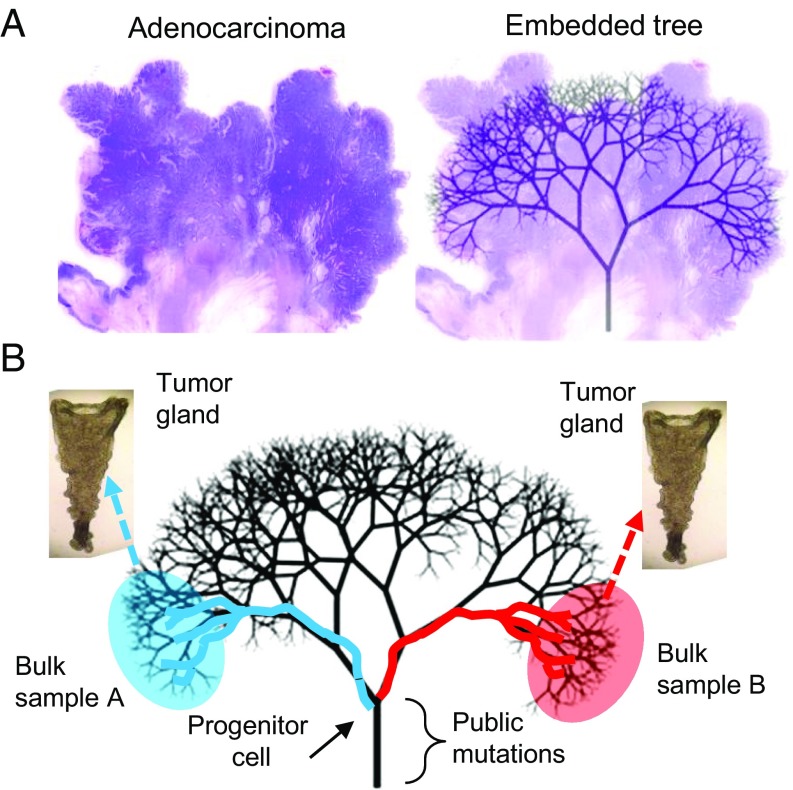
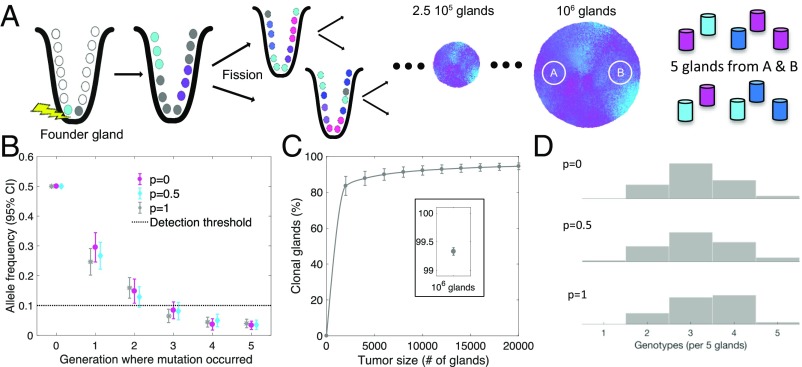
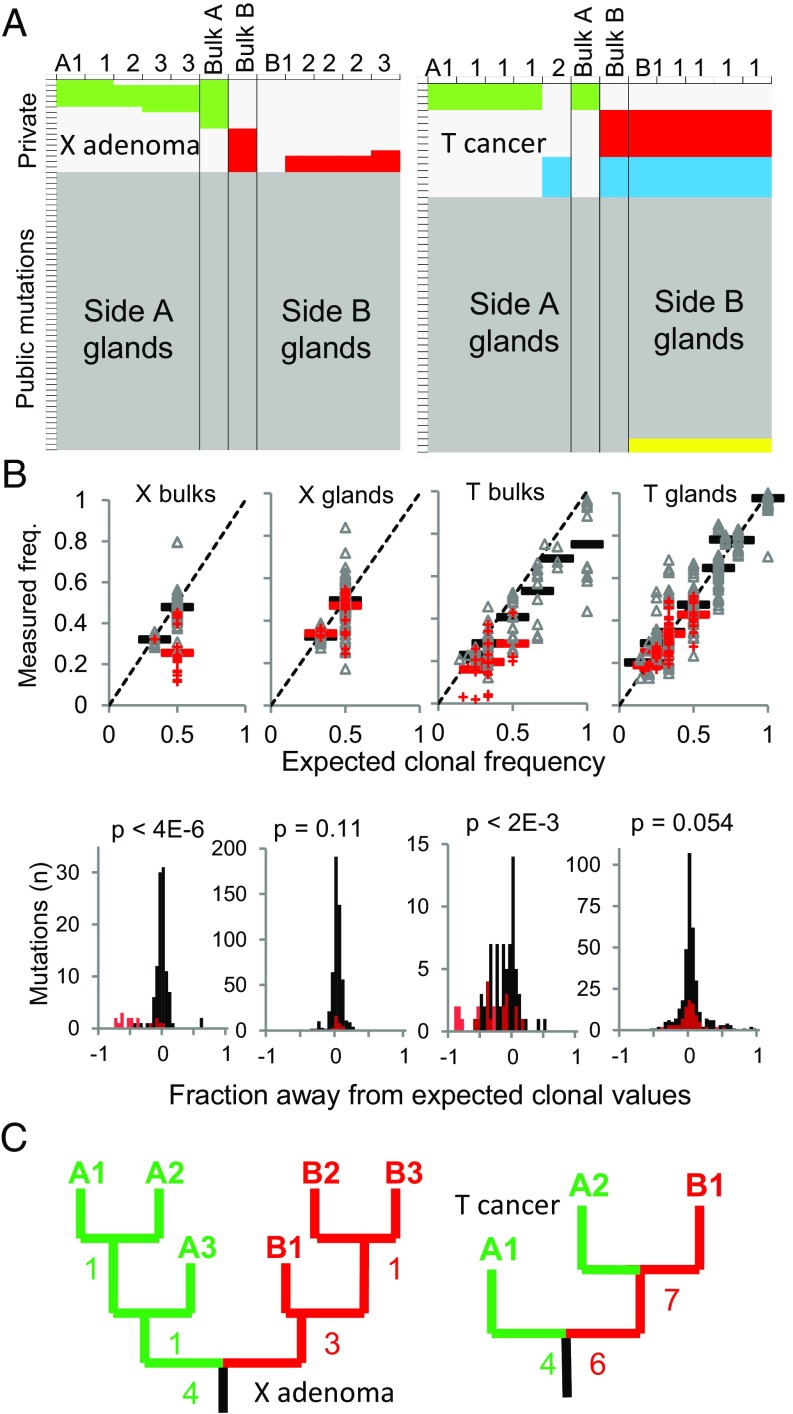
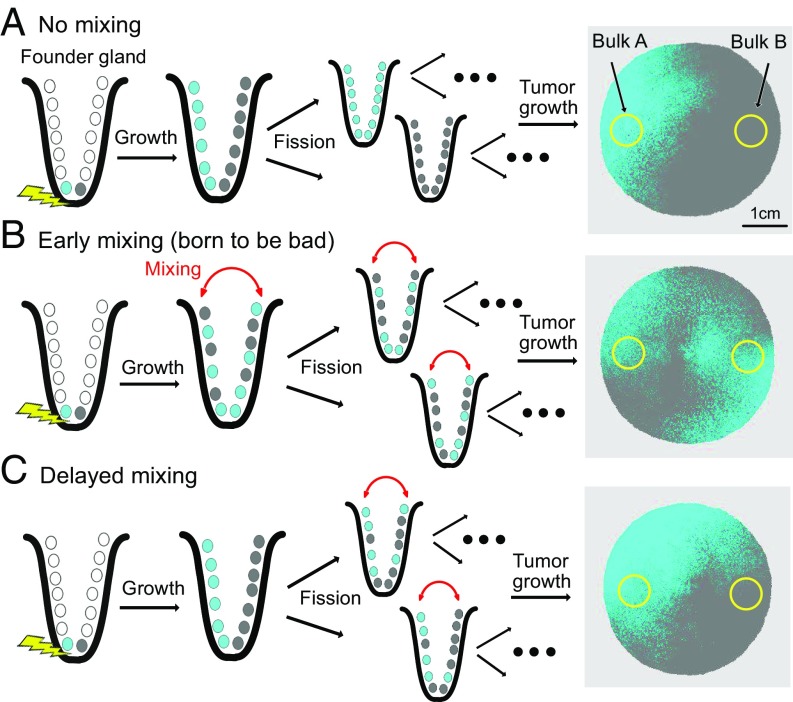
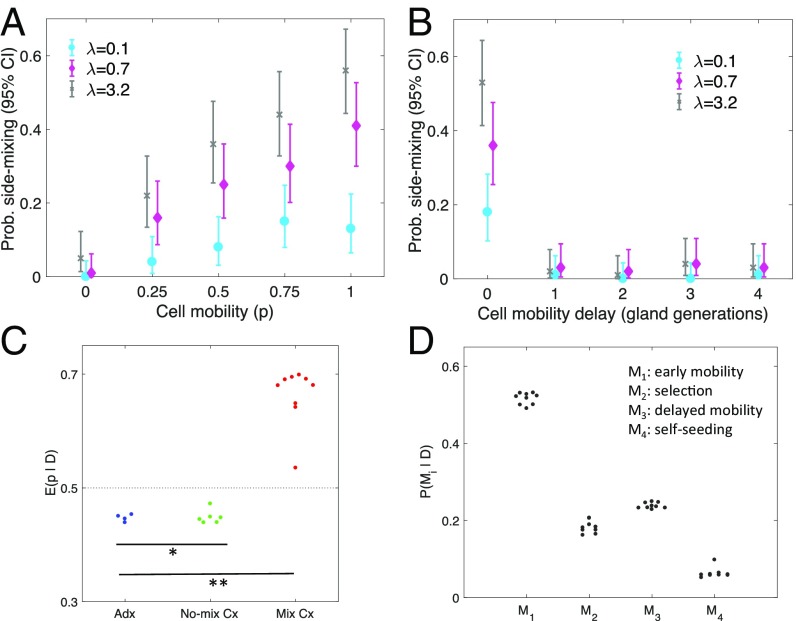
A growing body of evidence suggests that a subset of human cancers grows as single clonal expansions. In such a nearly neutral evolution scenario, it is possible to infer the early ancestral tree of a full-grown tumor. We hypothesized that early tree reconstruction can provide insights into the mobility phenotypes of tumor cells during their first few cell divisions. We explored this hypothesis by means of a computational multiscale model of tumor expansion incorporating the glandular structure of colorectal tumors. After calibrating the model to multiregional and single gland data from 19 human colorectal tumors using approximate Bayesian computation, we examined the role of early tumor cell mobility in shaping the private mutation patterns of the final tumor. The simulations showed that early cell mixing in the first tumor gland can result in side-variegated patterns where the same private mutations could be detected on opposite tumor sides. In contrast, absence of early mixing led to nonvariegated, sectional mutation patterns. These results suggest that the patterns of detectable private mutations in colorectal tumors may be a marker of early cell movement and hence the invasive and metastatic potential of the tumor at the start of the growth. In alignment with our hypothesis, we found evidence of early abnormal cell movement in 9 of 15 invasive colorectal carcinomas ("born to be bad"), but in none of 4 benign adenomas. If validated with a larger dataset, the private mutation patterns may be used for outcome prediction among screen-detected lesions with unknown invasive potential.

Keywords: cancer modeling; cellular mobility; intratumor heterogeneity; tumor evolution.


Conflict of interest statement

The authors declare no conflict of interest.

Figures

Fig. 1.
Fig. 1.
Tumor ancestral trees are physically embedded within their tumors. (A) The typical colorectal adenocarcinoma is spherical, and its cells are compartmentalized into glands. Present-day tumor cells coalesce back in time to progressively fewer ancestors. The final common ancestor is the progenitor cell. Cell mobility is relatively limited in solid glandular tumors, so a cell on one side of a large tumor will tend to remain on that side. Hence, the ancestral tree is physically embedded within the tumor. (B) Only a portion of the embedded tree can be sampled because the tree has billions of tips. With neutral evolution and a single expansion, sampling glands from opposite tumor sides misses most later branches but reliably samples earlier branches that coalesce to the progenitor cell. Because of growth, only mutations acquired early during growth attain allelic frequencies detectable by current sequencing technologies. Hence, most of the detectable information recorded by private mutations reflect the cell divisions and movements during the first few divisions after a tumor starts to grow.
Fig. 2.
Fig. 2.
Simulations reveal the critical role of early events during tumorigenesis in defining final tumor ITH. (A) The first cancer cell in the founder gland initiates the exponential growth phase of the tumor through cell divisions followed by consecutive gland fission (34)—that is, the division of one gland into two daughter glands. Tumors are simulated until they contain 1 million cancer glands (∼10 billion cells). Two bulk samples from opposite sides are extracted from the final tumor, and five glands are sampled at random from each bulk sample. (B) Only private mutations that arise during the first few generations are detectable in a bulk sample of the final tumor. The mean allelic frequency of a private mutation generated after the second generation drops below the next-generation sequencing detection threshold of 10% (dotted line); the strength of cell mobility (p) does not substantially influence the outcome. (C) During tumor growth, glands quickly become clonal with respect to detectable mutations. Once the tumor reaches a size of 10,000 glands, ∼90% are already clonal; at a size of 106 glands, virtually all glands are clonal (C, Inset). (D) Due to the absence of selective sweeps, neutral evolution predicts high local ITH. Histograms show the distribution of unique gland genotypes per five glands sampled from the left bulk region for p = 0, p = 0.5, and p = 1, respectively (each histogram based on 100 simulated tumors). Simulation parameters (unless otherwise specified): n = 16, λ = 1.13, p = 1.
Fig. 3.
Fig. 3.
ITH between opposite sides of tumors X and T. Data for other tumors are provided in Dataset S1. (A) Targeted DNA resequencing of bulk and individual gland samples defines public (dark gray) and private mutations. Private mutations are either side-specific (green is side A or left; red is side B or right) or found on both tumor sides (blue). Yellow panels indicate inferred mutation losses based on homoplasy (Methods). (B) Based on ploidy, public mutations (black) are near their expected clonal frequencies (freq.) in both bulk and gland specimens. Private mutations (red) are at lower than expected clonal frequencies in bulk specimens but indistinguishable from the public mutations in the gland specimens, indicating that ITH disappears within glands because they are composed of cells with identical genotypes. (C) Gland trees based on the gland data from A. Numbers indicate how many additional private mutations separate nodes. Each branch tip represents one of the unique gland genotypes.
Fig. 4.
Fig. 4.
Born to be bad. (A) The phenotype of the founding cell dictates the subsequent distribution of private mutations: a lack of cell mobility (p = 0) leads to side-segregated hemispheric distributions of private mutations. (B) Strong cell mobility (p = 1) leads to cell mixing in the first gland (born to be bad) and variegated distributions in the final tumor. (C) If the onset of a mobile cell phenotype is delayed to the second gland, private mutations remain segregated, similar to A. Simulation parameters (unless otherwise specified): n = 16; λ = 1; p = 1; final tumor size: 106 glands.
Fig. 5.
Fig. 5.
The footprints of early cell mobility. (A) The degree of cell mobility (p) strongly influences the probability (Prob.) of side-mixing (i.e., of finding one or more private mutations on both sides of the tumor). The probability to observing side-mixing is sensitive to the mutation burst rate (λ). (B) The importance of early cell mobility is emphasized by simulations where the onset of a mobile cell phenotype is delayed to the first, second, third, and fourth gland generation, respectively. Even with high cellular mobility (p = 1) and a high mutation burst rate (λ = 3.2), the probability of mixing is negligible if onset of a mobile cell phenotype is delayed beyond the founding gland. (C) The model is individually fit to each of the 19 human colorectal tumor samples, and the posterior mean of the cell mixing strength p is shown (dotted line is the prior mean of 0.5). In contrast to adenomas (Adx) and nonmixing carcinomas (No-mix Cx), there is evidence for cellular mobility in the mixing carcinomas (Mix Cx). *P < 0.03 [significant differences (Wilcoxon rank-sum test) between Mix Cx and Adx]; **P < 0.001 [significant differences (Wilcoxon rank-sum test) between Mix Cx and No-Mix Cx]. (D) For the mixing carcinomas, Bayesian model selection is used to compute the marginal posterior probabilities of the early cell mobility model (M1), a model with selection (M2), a model with delayed onset of cell mobility (M3), and a model with self-seeding of cells across the tumor mass (M4).

References

    1. Fearon ER, Vogelstein B. A genetic model for colorectal tumorigenesis. Cell. 1990;61:759–767. - PubMed
    1. Nowell PC. The clonal evolution of tumor cell populations. Science. 1976;194:23–28. - PubMed
    1. de Bruin EC, et al. Spatial and temporal diversity in genomic instability processes defines lung cancer evolution. Science. 2014;346:251–256. - PMC - PubMed
    1. Gerlinger M, et al. Intratumor heterogeneity and branched evolution revealed by multiregion sequencing. N Engl J Med. 2012;366:883–892. - PMC - PubMed
    1. Ling S, et al. Extremely high genetic diversity in a single tumor points to prevalence of non-Darwinian cell evolution. Proc Natl Acad Sci USA. 2015;112:E6496–E6505. - PMC - PubMed

Publication types

Substances