

Macronutrient and carbon supply, uptake and cycling across the Antarctic Peninsula shelf during summer
- PMID: 29760112
- PMCID: PMC5954468
- DOI: 10.1098/rsta.2017.0168
Macronutrient and carbon supply, uptake and cycling across the Antarctic Peninsula shelf during summer
Abstract
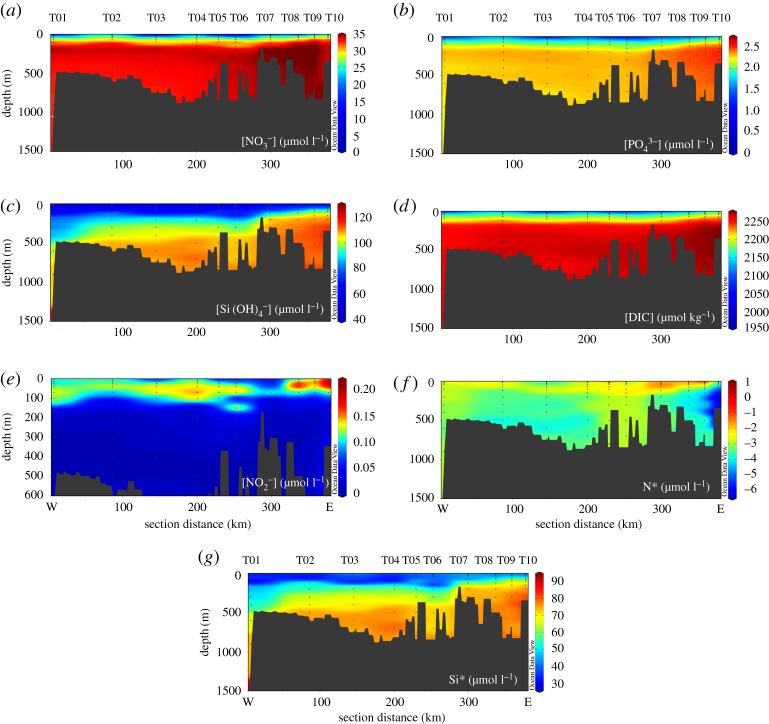
The West Antarctic Peninsula shelf is a region of high seasonal primary production which supports a large and productive food web, where macronutrients and inorganic carbon are sourced primarily from intrusions of warm saline Circumpolar Deep Water. We examined the cross-shelf modification of this water mass during mid-summer 2015 to understand the supply of nutrients and carbon to the productive surface ocean, and their subsequent uptake and cycling. We show that nitrate, phosphate, silicic acid and inorganic carbon are progressively enriched in subsurface waters across the shelf, contrary to cross-shelf reductions in heat, salinity and density. We use nutrient stoichiometric and isotopic approaches to invoke remineralization of organic matter, including nitrification below the euphotic surface layer, and dissolution of biogenic silica in deeper waters and potentially shelf sediment porewaters, as the primary drivers of cross-shelf enrichments. Regenerated nitrate and phosphate account for a significant proportion of the total pools of these nutrients in the upper ocean, with implications for the seasonal carbon sink. Understanding nutrient and carbon dynamics in this region now will inform predictions of future biogeochemical changes in the context of substantial variability and ongoing changes in the physical environment.This article is part of the theme issue 'The marine system of the West Antarctic Peninsula: status and strategy for progress in a region of rapid change'.
Keywords: Antarctic Peninsula; Circumpolar Deep Water; carbon cycling; nitrate isotopes; nitrogen cycle; nutrients.
© 2018 The Authors.
Conflict of interest statement
There are no competing interests associated with this work.
Figures

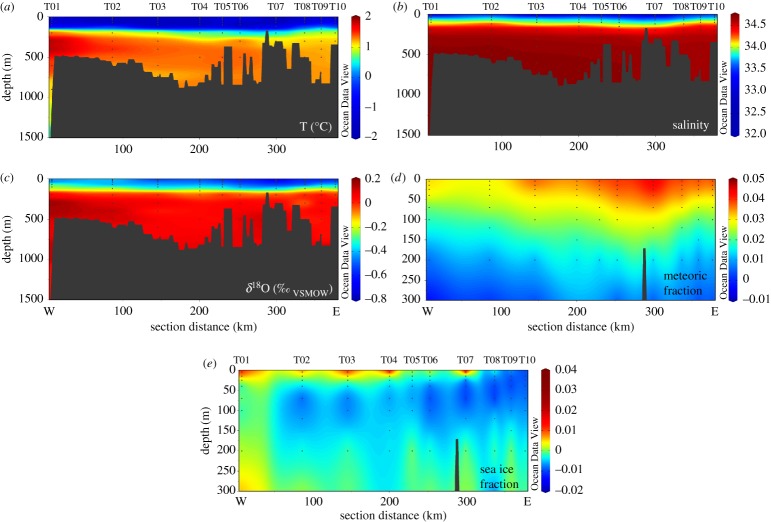
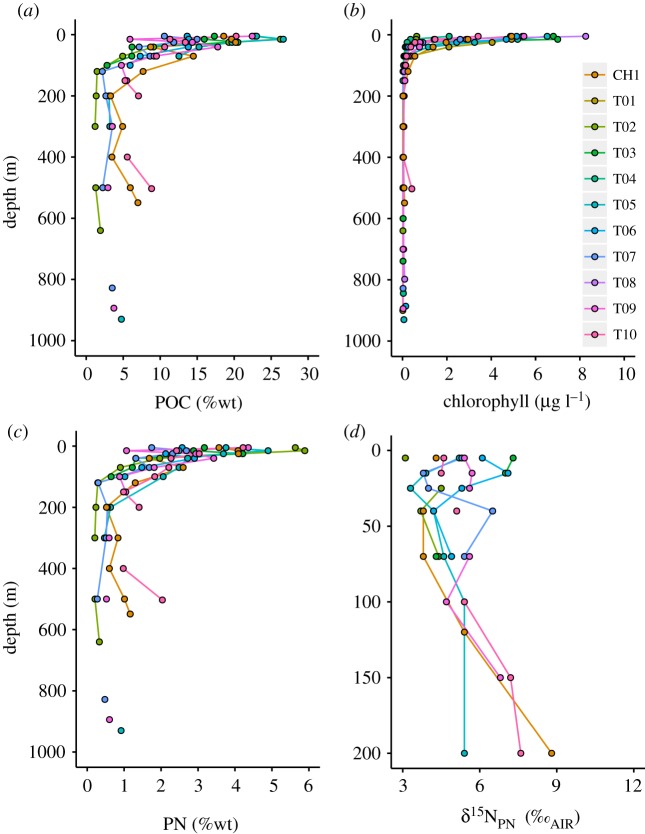
 and (c)
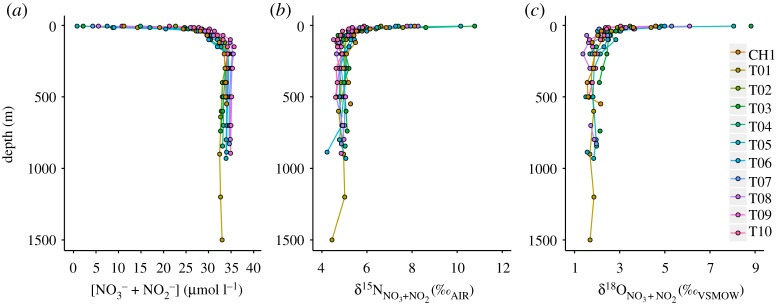
  for all stations, as per legend.
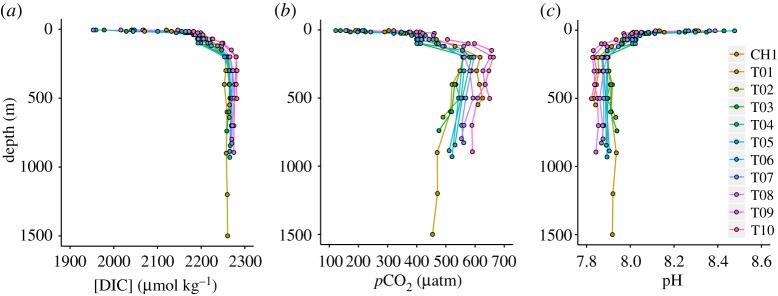
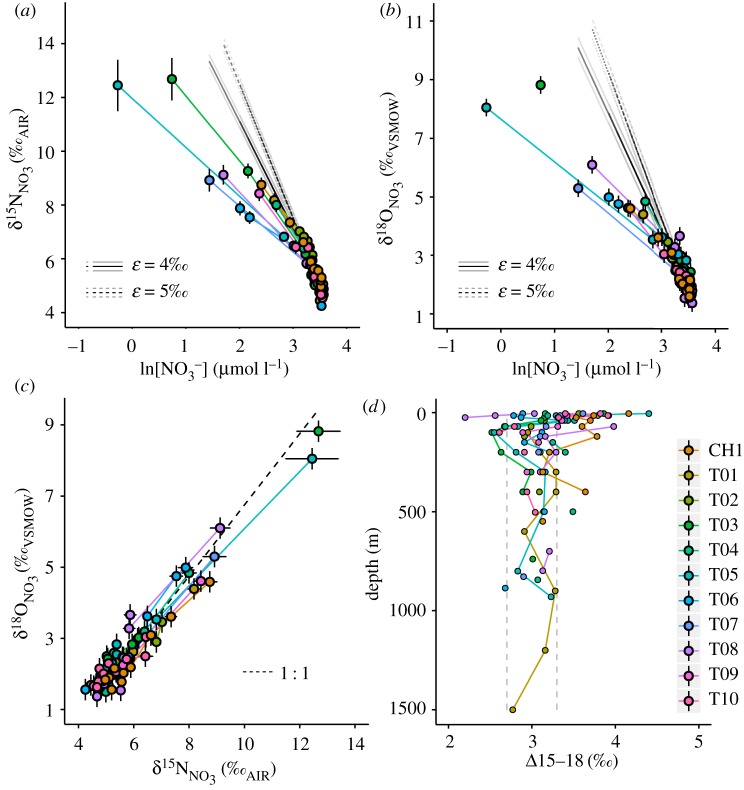
 versus ln[NO3−], (b)
  versus ln[NO3−] and (c)
  versus
  , and (d) a depth profile plot of Δ15–18 for all stations, as per legend. In (a) and (b), black lines depict the modelled relationships using ε values of 4‰ (solid) and 5‰ (dashed); grey lines depict the standard errors of modelled values. In (c), the dashed line depicts a 1 : 1 enrichment ratio of
  :
:  . Error bars for
  show the uncertainty associated with the correction for nitrite interference, which arises from the range of
  values measured in the Southern Ocean [64]. Error bars for
  depict analytical error. In (d), dashed grey lines depict the expected range of Δ15–18 in CDW.
Similar articles
-
Impact of sea-ice melt on dimethyl sulfide (sulfoniopropionate) inventories in surface waters of Marguerite Bay, West Antarctic Peninsula.Philos Trans A Math Phys Eng Sci. 2018 Jun 28;376(2122):20170169. doi: 10.1098/rsta.2017.0169. Philos Trans A Math Phys Eng Sci. 2018. PMID: 29760113 Free PMC article.
-
Shelf-ocean exchange and hydrography west of the Antarctic Peninsula: a review.Philos Trans A Math Phys Eng Sci. 2018 Jun 28;376(2122):20170164. doi: 10.1098/rsta.2017.0164. Philos Trans A Math Phys Eng Sci. 2018. PMID: 29760109 Free PMC article. Review.
-
A 'shallow bathtub ring' of local sedimentary iron input maintains the Palmer Deep biological hotspot on the West Antarctic Peninsula shelf.Philos Trans A Math Phys Eng Sci. 2018 Jun 28;376(2122):20170171. doi: 10.1098/rsta.2017.0171. Philos Trans A Math Phys Eng Sci. 2018. PMID: 29760114 Free PMC article.
-
Marine pelagic ecosystems: the west Antarctic Peninsula.Philos Trans R Soc Lond B Biol Sci. 2007 Jan 29;362(1477):67-94. doi: 10.1098/rstb.2006.1955. Philos Trans R Soc Lond B Biol Sci. 2007. PMID: 17405208 Free PMC article. Review.
-
Evidences of strong sources of DFe and DMn in Ryder Bay, Western Antarctic Peninsula.Philos Trans A Math Phys Eng Sci. 2018 Jun 28;376(2122):20170172. doi: 10.1098/rsta.2017.0172. Philos Trans A Math Phys Eng Sci. 2018. PMID: 29760115 Free PMC article.
Cited by
-
Impact of sea-ice melt on dimethyl sulfide (sulfoniopropionate) inventories in surface waters of Marguerite Bay, West Antarctic Peninsula.Philos Trans A Math Phys Eng Sci. 2018 Jun 28;376(2122):20170169. doi: 10.1098/rsta.2017.0169. Philos Trans A Math Phys Eng Sci. 2018. PMID: 29760113 Free PMC article.
-
The marine system of the West Antarctic Peninsula: status and strategy for progress.Philos Trans A Math Phys Eng Sci. 2018 Jun 28;376(2122):20170179. doi: 10.1098/rsta.2017.0179. Philos Trans A Math Phys Eng Sci. 2018. PMID: 29760121 Free PMC article. No abstract available.
-
Oceanographic Variability induced by Tides, the Intraseasonal Cycle and Warm Subsurface Water intrusions in Maxwell Bay, King George Island (West-Antarctica).Sci Rep. 2019 Dec 9;9(1):18571. doi: 10.1038/s41598-019-54875-8. Sci Rep. 2019. PMID: 31819101 Free PMC article.
References
-
- Gruber N, et al. 2009. Oceanic sources, sinks, and transport of atmospheric CO2. Glob. Biogeochem. Cycles 23, GB1005 (10.1029/2008GB003349) - DOI
-
- Lenton A, et al. 2013. Sea–air CO2 fluxes in the Southern Ocean for the period 1990–2009. Biogeosciences 10, 4037–4054. (10.5194/bg-10-4037-2013) - DOI
-
- Arrigo KR, van Dijken GL, Bushinsky S. 2008. Primary production in the Southern Ocean, 1997–2006. J. Geophys. Res. Oceans 113, C08004 (10.1029/2007JC004551) - DOI
LinkOut - more resources
Full Text Sources
Other Literature Sources
