. 2018 Sep;67(9):1614-1625.
doi: 10.1136/gutjnl-2018-315988. Epub 2018 May 14.

Dysbiosis of maternal and neonatal microbiota associated with gestational diabetes mellitus

Affiliations

Dysbiosis of maternal and neonatal microbiota associated with gestational diabetes mellitus

Jinfeng Wang et al. Gut. 2018 Sep.

Abstract

Objective: The initial colonisation of the human microbiota and the impact of maternal health on neonatal microbiota at birth remain largely unknown. The aim of our study is to investigate the possible dysbiosis of maternal and neonatal microbiota associated with gestational diabetes mellitus (GDM) and to estimate the potential risks of the microbial shift to neonates.

Design: Pregnant women and neonates suffering from GDM were enrolled and 581 maternal (oral, intestinal and vaginal) and 248 neonatal (oral, pharyngeal, meconium and amniotic fluid) samples were collected. To avoid vaginal bacteria contaminations, the included neonates were predominantly delivered by C-section, with their samples collected within seconds of delivery.

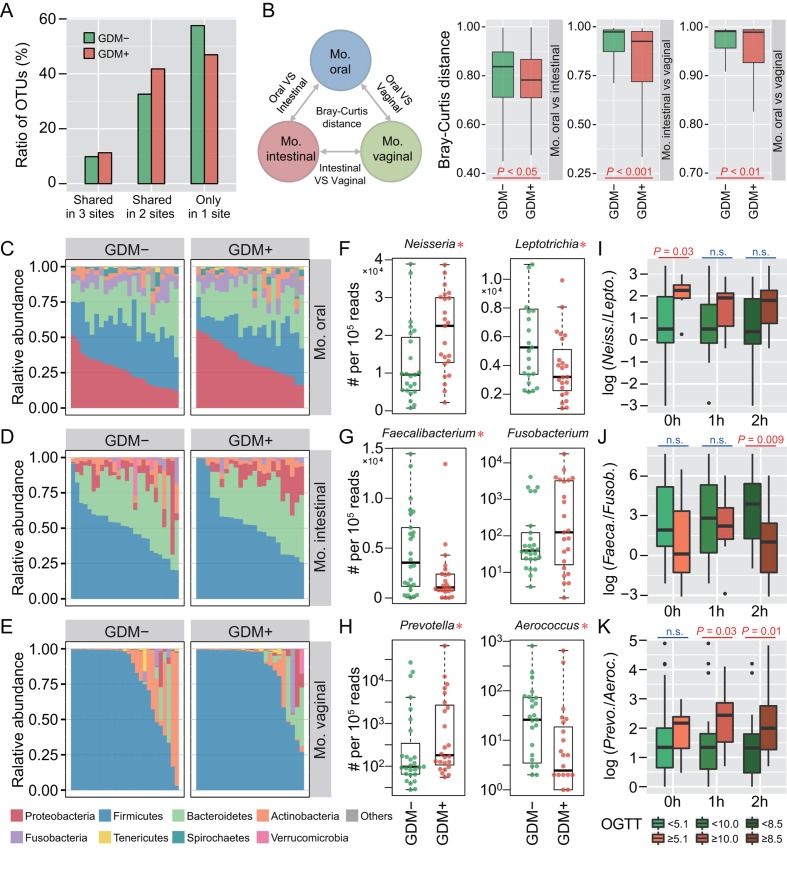
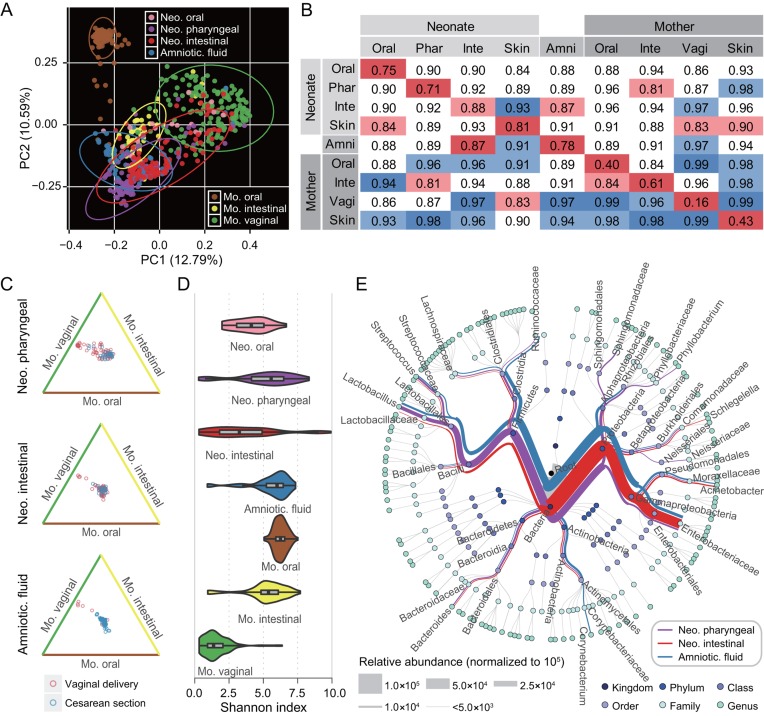
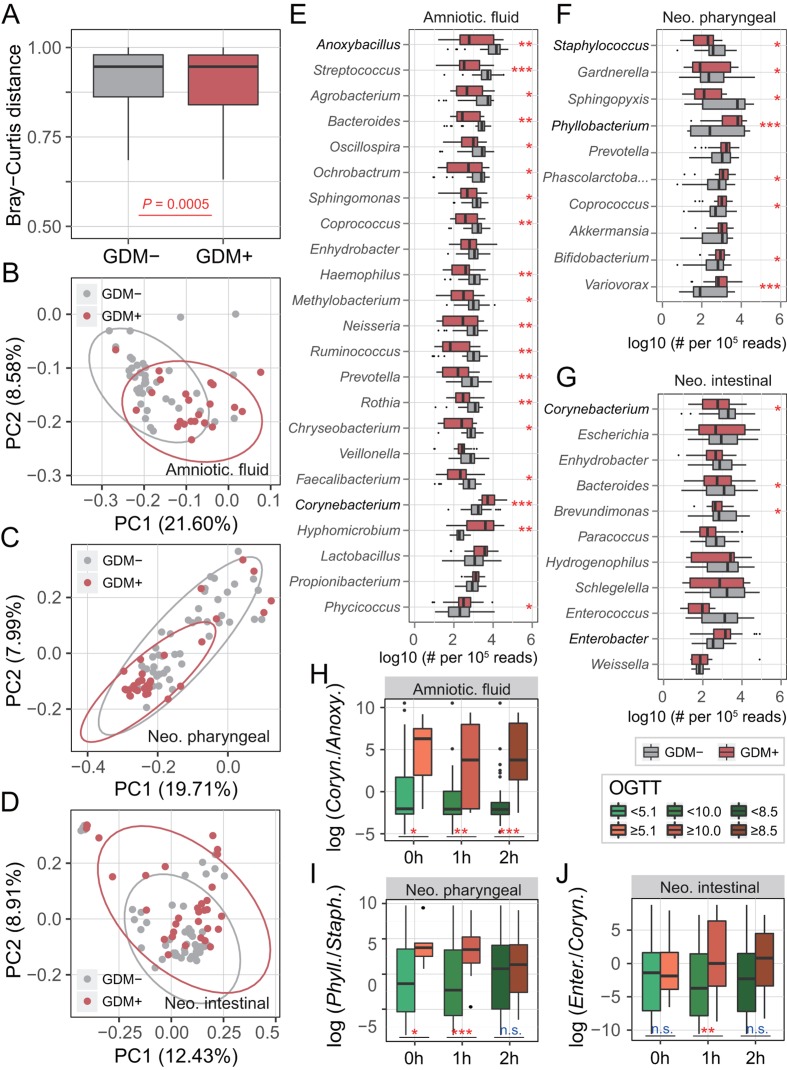
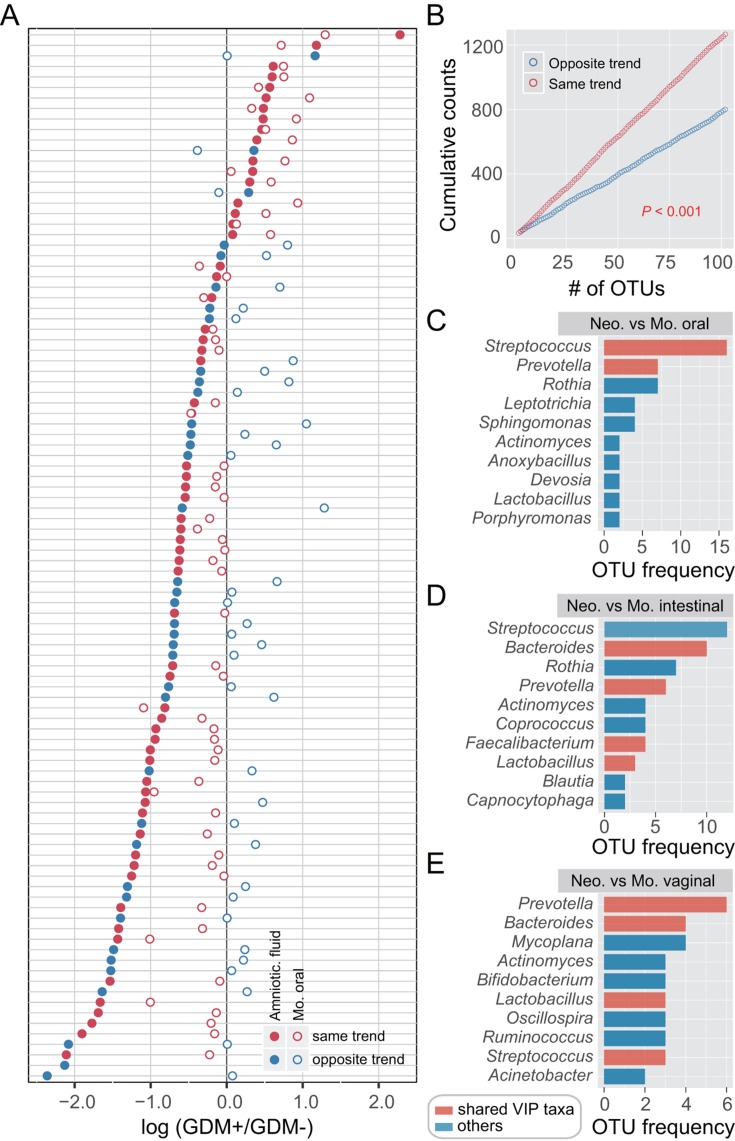
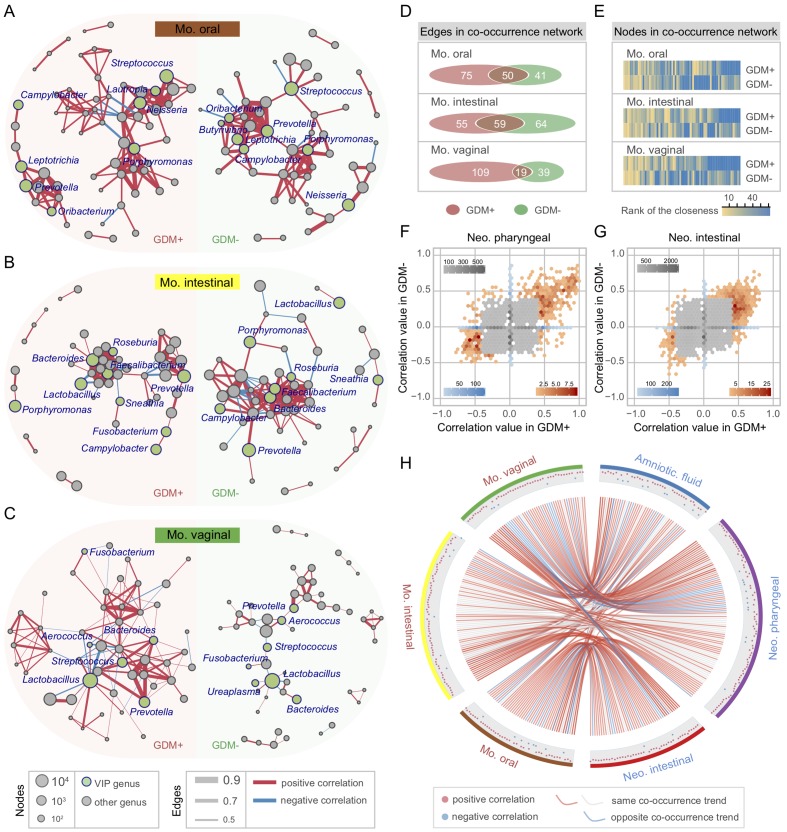
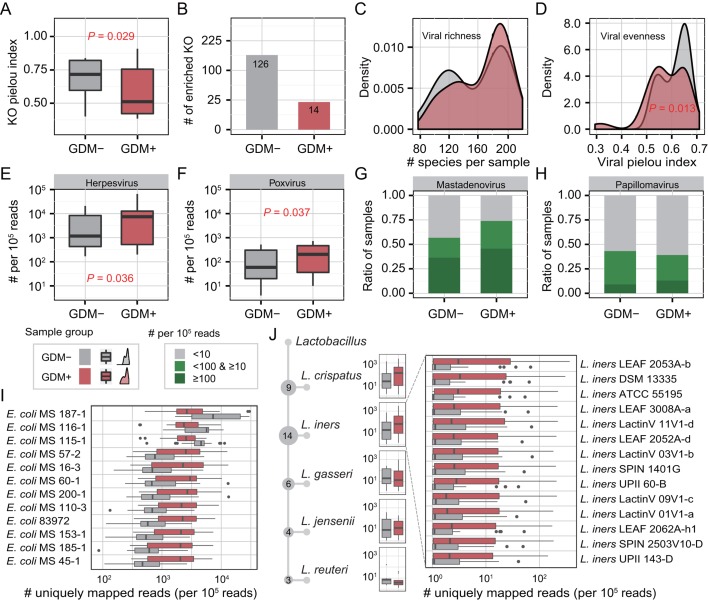
Results: Numerous and diverse bacterial taxa were identified from the neonatal samples, and the samples from different neonatal body sites were grouped into distinct clusters. The microbiota of pregnant women and neonates was remarkably altered in GDM, with a strong correlation between certain discriminatory bacteria and the oral glucose tolerance test. Microbes varying by the same trend across the maternal and neonatal microbiota were observed, revealing the intergenerational concordance of microbial variation associated with GDM. Furthermore, lower evenness but more depletion of KEGG orthologues and higher abundance of some viruses (eg, herpesvirus and mastadenovirus) were observed in the meconium microbiota of neonates associated with GDM.

Conclusion: GDM can alter the microbiota of both pregnant women and neonates at birth, which sheds light on another form of inheritance and highlights the importance of understanding the formation of early-life microbiome.

Keywords: GDM; microbiota; neonate; pregnancy.


Conflict of interest statement

Competing interests: None declared.

Figures

Figure 1
Figure 1
Microbial variations of the pregnant women suffering from gestational diabetes mellitus (GDM). (A) Proportions of shared operational taxonomic units (OTU) among maternal oral, intestinal and vaginal microbiota. Shared OTU denotes that a certain OTU was detectable in two or three body sites. (B) Bacterial community dissimilarities between any two body sites of maternal samples. Bray-Curtis distances were independently calculated for GDM+ and GDM− groups. VS represents versus. Statistical significance was determined by the Mann-Whitney test. (C–E) Relative abundance of bacterial phyla in the oral, intestinal and vaginal microbiota of pregnant women. (F–H) Bacterial genera with significant (Mann-Whitney test with false discovery rate (FDR) correction; *p<0.1) differences between GDM+ and GDM− groups. Genus abundance in each sample was normalised to 100 000 reads. (I–K) Correlations between significantly differential bacteria and oral glucose tolerance test (OGTT) values. The labels 0 hour, 1 hour and 2 hours under box plots represent the OGTT testing time points. A pair of boxes indicates the bacterial ratios corresponding to the blood glucose levels below (left box) or above (right box) the threshold values (5.1 at 0 hour, 10.0 at 1 hour and 8.5 at 2 hours during OGTT). A significant difference (Mann-Whitney test, p<0.05) is indicated by the character in red colour, while ns in blue colour denotes a non-significant difference (Mann-Whitney test, p≥0.05).
Figure 2
Figure 2
Colonisation and body site specificity of the neonatal microbiota at birth. (A) Principal coordinate analysis (PCoA) of the unweighted UniFrac distances for maternal oral, intestinal and vaginal samples, and neonatal amniotic fluid, oral, pharyngeal and meconium samples. Ellipses represent a 95% CI. (B) Bacterial community dissimilarities within and between body sites. The labels Phar, Inte, Amni and Vagi represent pharyngeal, intestinal, amniotic fluid and vaginal microbiota, respectively. The average Bray-Curtis distance for each group of pairwise comparisons is provided. Red and blue shadows indicate the smallest and the largest values in each column, respectively. (C) Effect of delivery modes on neonatal bacterial communities. Three edges of a triangle represent maternal oral (brown), intestinal (yellow) and vaginal (green) microbiota. Each hollow point represents a neonatal sample, and its vertical distance to three edges of the triangle indicates the average Bray-Curtis distance between this sample and the maternal samples. Points closer to the edges denote that such neonatal samples are more similar in bacterial community to the indicated maternal microbiota. (D) Alpha diversities of neonatal and maternal microbiota. The violin with box plot shows the median and IQR of the diversity indices of a sample type, and the width of the violin represents the density distribution of the indices. (E) Taxonomic profiling of neonatal pharyngeal, intestinal and amniotic fluid microbiota. The average relative abundance of each taxonomic category is represented by the thickness of a branch. Each node in the phylogenetic tree represents one microbial taxon.
Figure 3
Figure 3
Neonatal microbiota associated with gestational diabetes mellitus (GDM). (A) Bacterial community dissimilarities between neonatal microbiota. Bray-Curtis distances were calculated for GDM+ and GDM− samples independently. Statistical significance was determined by the Mann-Whitney test. (B–D) Principal coordinate analysis (PCoA) of the unweighted UniFrac distances for amniotic fluid, pharyngeal and meconium microbiota. Ellipses represent a 95% CI. (E–G) The most abundant genera with significant difference between GDM+ and GDM− groups. Genus abundance in each sample was normalised to 100 000 reads. Mann-Whitney test with false discovery rate (FDR) correction: none. *p<0.1; *p<0.05; **p<0.01; ***p<0.001. A pair of taxa was highlighted in dark colour because their relative abundance was the largest among the significantly enriched and depleted genera of GDM+ in each sample type. (H–J) Correlation between significantly differential bacteria of neonatal microbiota and oral glucose tolerance test (OGTT) values. The labels of 0 hour, 1 hour and 2 hours represent three testing time points of the OGTT. A pair of boxes shows the bacterial ratios corresponding to the blood glucose levels below (left box) or above (right box) the threshold values (5.1 at 0 hour, 10.0 at 1 hour and 8.5 at 2 hours during OGTT). Mann-Whitney test; *p<0.05; **p<0.01; ***p<0.001; ns p≥0.05.
Figure 4
Figure 4
Similar microbial shifts between maternal and neonatal microbiota associated with gestational diabetes mellitus (GDM). Operational taxonomic unit (OTU) abundance in each sample was normalised to 100 000 reads. (A) Concordancy of OTU variations between amniotic fluid and maternal oral microbiota. The average relative abundance of the top 100 most abundant OTUs was compared between GDM+ and GDM− groups. Solid points represent OTUs of amniotic fluid microbiota, and hollow points represent maternal oral microbiota. Red points denote OTUs varying by the same trend, while blue points denote the opposite trend. (B) Cumulative counts of OTUs varying by the same trend or the opposite trend. p<0.001, t-test. (C–E) The most prevalent taxa showing the concordance of microbial variation between mothers and neonates. Each colour bar indicates the OTU frequency of a certain genus. The bar in red represents a variable importance for the projection (VIP) genus associated with GDM that is shared among maternal and neonatal sample types.
Figure 5
Figure 5
Bacterial co-occurrence network and concordance between maternal and neonatal microbiota associated with gestational diabetes mellitus (GDM). (A–C) Co-occurrence networks of maternal oral, intestinal and vaginal microbiota of GDM+ (left panel) and GDM− (right panel). The co-occurrence network was inferred for each maternal sample type by a pairwise correlation of relative abundance (normalised to 100 000) for all genera. Each node in the network indicates a bacterial genus. Node size represents the average relative abundance of one genus in each maternal sample type. Nodes in green colour show variable importance for the projection (VIP) genera associated with GDM. Only the bacterial connections (edges) larger than cut-offs (correlation values >0.4, 0.45 and 0.5 in the three networks, respectively) are retained. Edge width represents the correlation value supporting this connection. Edge colour shows positive (red) and negative (blue) correlations, respectively. (D, E) Discrepancies of the bacterial co-occurrence networks between maternal GDM+ and GDM−. The number of unique and shared edges, and centralities (rank of the closeness) and discrepancies of nodes in GDM+ and GDM− co-occurrence networks were counted, respectively. (F–G) Discrepancies of the bacterial correlations between neonatal GDM+ and GDM− microbiota. Each bin shows the number of the same pair of bacterial correlations occurred in both GDM+ and GDM−, with the colour changes representing weak (grey) or strong (blue and red) correlations, respectively. (H) Concordance of bacterial correlations between maternal and neonatal microbiota associated with GDM. The concordance was inferred by counting the same bacterial correlations (cut-off >0.4) across different sample types. Each point in the outer cycle represents one connection of two correlated bacteria (at least one is VIP genus). The curve in red (occurred only in GDM+) and grey (occurred in both GDM+ and GDM−) denotes the same co-occurrence trend of such connection between maternal and neonatal microbiota, while the curve in blue denotes the opposite trend.
Figure 6
Figure 6
Microbial and functional variation in meconium microbiota associated with gestational diabetes mellitus (GDM). (A) Evenness of the KEGG orthology (KO). (B) The number of enriched KOs. (C, D) Distribution of viral richness and evenness. (E, F) Relative abundance of herpesvirus and poxvirus. Viral abundance in each sample was normalised to 100 000 reads. (G, H) Prevalence of mastadenovirus and papillomavirus in meconium. (I, J) Significant differentiation of Escherichia and Lactobacillus strains between GDM+ and GDM−. Genomes of Escherichia and Lactobacillus strains isolated from the human oral cavity, gut or vagina were downloaded from the Human Microbiome Project (HMP) and were taken as references. Sequencing reads were mapped to these references, and strain abundance in each sample was normalised to 100 000 reads.

Similar articles

Cited by

References

    1. Cho I, Blaser MJ. The human microbiome: at the interface of health and disease. Nat Rev Genet 2012;13:260–70. 10.1038/nrg3182 - DOI - PMC - PubMed
    1. Tamburini S, Shen N, Wu HC, et al. . The microbiome in early life: implications for health outcomes. Nat Med 2016;22:713–22. 10.1038/nm.4142 - DOI - PubMed
    1. Kindinger LM, MacIntyre DA, Lee YS, et al. . Relationship between vaginal microbial dysbiosis, inflammation, and pregnancy outcomes in cervical cerclage. Sci Transl Med 2016;8:350ra102 10.1126/scitranslmed.aag1026 - DOI - PubMed
    1. Kim S, Kim H, Yim YS, et al. . Maternal gut bacteria promote neurodevelopmental abnormalities in mouse offspring. Nature 2017;549:528–32. 10.1038/nature23910 - DOI - PMC - PubMed
    1. Fujimura KE, Sitarik AR, Havstad S, et al. . Neonatal gut microbiota associates with childhood multisensitized atopy and T cell differentiation. Nat Med 2016;22:1187–91. 10.1038/nm.4176 - DOI - PMC - PubMed

Publication types