. 2018 Jun 6;38(23):5399-5414.
doi: 10.1523/JNEUROSCI.3214-17.2018. Epub 2018 May 14.

Modulation of Receptor Protein Tyrosine Phosphatase Sigma Increases Chondroitin Sulfate Proteoglycan Degradation through Cathepsin B Secretion to Enhance Axon Outgrowth

Affiliations

Modulation of Receptor Protein Tyrosine Phosphatase Sigma Increases Chondroitin Sulfate Proteoglycan Degradation through Cathepsin B Secretion to Enhance Axon Outgrowth

Amanda Phuong Tran et al. J Neurosci. .

Abstract

Severed axon tips reform growth cones following spinal cord injury that fail to regenerate, in part, because they become embedded within an inhibitory extracellular matrix. Chondroitin sulfate proteoglycans (CSPGs) are the major axon inhibitory matrix component that is increased within the lesion scar and in perineuronal nets around deafferented neurons. We have recently developed a novel peptide modulator (intracellular sigma peptide) of the cognate receptor of CSPGs, protein tyrosine phosphatase σ (RPTPσ), which has been shown to markedly improve sensorimotor function, micturition, and coordinated locomotor behavior in spinal cord contused rats. However, the mechanism(s) underlying how modulation of RPTPσ mediates axon outgrowth through inhibitory CSPGs remain unclear. Here, we describe how intracellular sigma peptide modulation of RPTPσ induces enhanced protease Cathepsin B activity. Using DRG neurons from female Sprague Dawley rats cultured on an aggrecan/laminin spot assay and a combination of biochemical techniques, we provide evidence suggesting that modulation of RPTPσ regulates secretion of proteases that, in turn, relieves CSPG inhibition through its digestion to allow axon migration though proteoglycan barriers. Understanding the mechanisms underlying RPTPσ modulation elucidates how axon regeneration is impaired by proteoglycans but can then be facilitated following injury.SIGNIFICANCE STATEMENT Following spinal cord injury, chondroitin sulfate proteoglycans (CSPGs) upregulate and potently inhibit axon regeneration and functional recovery. Protein tyrosine phosphatase σ (RPTPσ) has been identified as a critical cognate receptor of CSPGs. We have previously characterized a synthetic peptide (intracellular sigma peptide) that targets the regulatory intracellular domain of the receptor to allow axons to regenerate despite the presence of CSPGs. Here, we have found that one important mechanism by which peptide modulation of the receptor enhances axon outgrowth is through secretion of a protease, Cathepsin B, which enables digestion of CSPGs. This work links protease secretion to the CSPG receptor RPTPσ for the first time with implications for understanding the molecular mechanisms underlying neural regeneration and plasticity.

Keywords: CSPG; DRG; RPTPσ; axon regeneration; cathepsin B; protease.


Figures

Figure 1.
Figure 1.
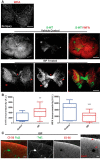
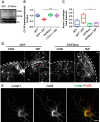
ISP treatment enhances GAG-CSPG degradation by neurons. A, Systemic ISP enhances GAG-CSPG amelioration following spinal cord injury. Rats received 250k dyne thoracic level 8 contusion and treated for 7 weeks with subcutaneous injections of DMSO vehicle or 22 μg/ml ISP beginning 1 d after injury. Tissue was collected 7 weeks after last ISP treatment and stained to visualize serotonergic (5-HT) axons and GAG-CSPGs (WFA). Noninjured spinal cord of an adult rat was immunostained with WFA to visualize normal GAG-CSPG pattern. Scale bar, 500 μm. B, Quantification of 5-HT (n = 25 sections; t = 3.320, df = 64, p = 0.0015, unpaired t test) and WFA (n = 39 sections; t = 4.657, df = 84, p = 0.0001, unpaired t test) immunoreactivity in sections caudal to the injury site. C, DRG axons (Tuj1) leave digested shadows as they cross the high CSPG gradient (CS-56) in our aggrecan spot assays when treated with low concentrations of ISP (1.25 μm). Scale bar, 50 μm. Red arrows indicate regions of absent GAG-CSPGs colocalized with neuronal expression. Lines indicate median. Boxes represent quartiles. Whiskers indicate range. **p < 0.01, ***p < 0.001.
Figure 2.
Figure 2.
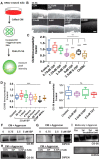
ISP promotes GAG chain degradation in coverslip-bound aggrecan/laminin spot assays. A, CM from 4 DIV or 0.1 U/ml ChABC-treated DRGs were incubated with aggrecan spots for 2 DIV, then stained with CS-56 and analyzed. B, Representative aggrecan spot images. Scale bar, 200 μm. C, ISP degrades aggrecan GAG-CSPGs in a dose-dependent manner (n = 120, 73, 69, 92, 77, 59, 50; F(7,173) = 47.21, CON vs 2.5 μm ISP, p = 0.0001; CON vs 5 μm ISP, p = 0.0001; CON vs 2.5 μm S-ISP, p = 0.0006; CON vs ChABC, p = 0.0001; 2.5 μm ISP vs S-ISP, p = 0.0097; ANOVA). D, ISP degradation of GAG chains is time-dependent and significant at 48 h of incubation with DRGs (n = 47, 31, 32, 41, 30, 39, 78; F(6,291) = 30.77, p = 0.001, ANOVA). E, As a control, equal molar concentrations of peptide alone in media do not degrade GAG chains (n = 34, 27, 28, 22; F(3,107) = 1.684, not significant, p = 0.1748, ANOVA). F, Western blots of CM from DRGs treated with varying concentrations of ISP incubated with 20 μg/ml aggrecan confirm CS-56 spot degradation; n = 4 blots. G, DIPEN, a neo-epitope present once aggrecan is cleaved, increases with ISP dose; n = 3. H, Western blots of CM from vehicle control, 2.5 μm ISP, and 2.5 μm S-ISP incubated with 20 μg/ml aggrecan blotted with CS-56 and DIPEN; n = 2. I, Control Western blots of media incubated for varying times show intact CS-56 and no DIPEN signal; n = 3. Lines indicate median. Boxes represent quartiles. Whiskers indicate range. **p < 0.01, ***p < 0.001.
Figure 3.
Figure 3.
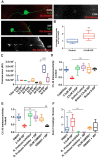
ISP promotes GAG chain degradation through increasing protease activity. A, Representative image of an ISP-treated DRG axon digesting DQ Gelatin as it crosses the CSPG gradient in our spot assay and vehicle control DRG axon. Scale bar, 50 μm. B, Quantification of ratio of cleaved DQ Gelatin overlapping Tuj1-labeled axons (n = 34, 32; t = 4.025, df = 15, p = 0.0011, unpaired t test). C, EnzChek measures fluorescence of cleaved casein of CM from DRGs treated with CON, 2.5 μm ISP or SISP for 1, 2, or 4 DIV (n = 11, 16, 16, 16, 16, 16, 19, 18, 20; F(8,27) = 15.4, p = 0.0001; ANOVA). D, Aggrecan spot GAG chain degradation is rescued following boiling CM, then incubating with guanidine hydrochloride (5 m) before plating (n = 71, 49, 50, 51, 68, 50; F(5,87) = 37.13, p = 0.0001; ANOVA). E, Aggrecan spot degradation was rescued by 0.1% Roche general protease inhibitor mixture, but not broad MMP inhibitor, GM6001 (25 μm) (n = 114, 161, 197, 97, 100, 63; F(5,112) = 82.05, ISP vs RPI+ISP, p = 0.001; ISP vs GM6001+ISP, not significant, p = 0.9964; ANOVA). F, Axon crossings, normalized by the total number of neurons in the spot, were decreased with protease inhibitor treatment (n = 28, 10, 10, 29, 17, 20; F(5,37) = 5.255, DMSO vs ISP, p = 0.0042; ISP vs RPI+ISP, p = 0.0064; ANOVA). Lines indicate median. Boxes represent quartiles. Whiskers indicate range. **p < 0.01, ***p < 0.001.
Figure 4.
Figure 4.
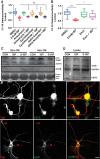
ISP promotes secretion of CatB. A, ISP-dependent aggrecan spot degradation is not dependent on transcription or translation, as shown by anisomycin (20 μg/ml), cycloheximide (20 μg/ml), or α-amanitin (20 μg/ml) treatment of DRGs (n = 103, 91, 54, 50, 73, 57, 72, 60; F(7,113) = 2.6, not significant; ISP vs anisomycin+ISP, p = 0.3855; ISP vs cycloheximide+ISP, p = 0.490; ISP vs α-amanatin, p = 0.6309; ANOVA). B, Inhibiting exocytosis with a high concentration of Exo1 (10 μg/ml) rescues GAG chain degradation by ISP (n = 115, 187, 160, 76; F(3109) = 35.18, DMSO vs ISP, p = 0.0003; ISP vs Exo1+ISP, p = 0.0108; ANOVA). C, Western blot of CatB and CSTB from DRG CM collected after 2 or 4 DIV treated with vehicle control, 2.5 μm ISP, or S-ISP; n = 5. The same blot was stained with total protein dye, Coomassie Blue. D, Western blot of CatB, CSTB, or GAPDH from DRG lysate treated with vehicle control, 2.5 μm ISP, or S-ISP for 4 DIV; n = 3. DRGs stained with Tuj1 and CSTB (E) or CatB (F). Scale bar, 50 μm. Lines indicate median. Boxes represent quartiles. Whiskers indicate range. **p < 0.01, ***p < 0.001.
Figure 5.
Figure 5.
Pretreatment of aggrecan spots with ISP-treated CM or rCatB enhances axon crossings through the aggrecan gradient. A, EnzChek protease assay of recombinant CatB ± recombinant CSTB (rCSTB) (n = 6; F(4,5) = 11.32, p = 0.0101, ANOVA). B, Aggrecan spot degradation with CM from vehicle, 2.5 μm ISP, or S-ISP-treated DRGs, or media-only, 0.1 U/ml ChABC, 50 ng/ml recombinant CatB, 10 ng/ml recombinant CSTB alone or in combination with vehicle, or 2.5 μm ISP-treated DRG CM (n = 106, 157, 141, 136, 21, 45, 11, 63, 47; F(12,155) = 30.35, media-only vs ChABC, p = 0.0019; media-only vs ISP, p = 0.0001; media-only vs rCatB, p = 0.0001; ISP vs ISP+rCSTB, p = 0.0001; ANOVA). C, D, Axon crossings normalized by total neurons present on aggrecan spots pretreated with CM collected from vehicle, 2.5 μm ISP or SISP, or 0.1 U/ml ChABC, recombinant CatB (0.5 μg/ml) with or without recombinant CSTB (50 μg/ml) with representative images. Scale bar, 50 μm. Dotted lines indicate CSPG border. Inset, Axon crossing CSPG gradient (n = 11, 20, 12, 12, 12, 17, 30, 29; F(7,32) = 9.719, media vs ChABC, p = 0.0018; S-ISP vs rCatB, p = 0.0207; ISP CM vs ChABC, not significant, p = 0.5606; ISP vs ISP+rCSTB, p = 0.0402; ANOVA). Lines indicate median. Boxes represent quartiles. Whiskers indicate range. *p < 0.05, **p < 0.01, ***p < 0.001.
Figure 6.
Figure 6.
Overexpression of CSTB (CSTBo/e) decreases ISP-treated DRG axon crossings through CSPGs. A, Western blot of DRG lysates inoculated with lentiviral particles expressing GFP or CSTBo/e constructs. B, Aggrecan degradation from CM collected from GFP control or CSTBo/e DRGs treated with vehicle or 2.5 μm ISP (n = 152, 63, 98, 80; F(5,115) = 51.03, p = 0.0001; ANOVA). C, Spot crossings of DRGs treated with lentiviral particles expressing GFP or CSTB overexpressing constructs (n = 12; F(3,12) = 3.743, p = 0.0415; ANOVA). D, Representative images of DRG axons crossing aggrecan spots. Dotted lines indicate CSPG border. Inset, Axon crossing CSPG gradient. Scale bar, 50 μm. E, CatB is associated with lysosomes (Lamp1) in DRGs. Scale bars, 50 μm. Lines indicate median. Boxes represent quartiles. Whiskers indicate range. *p < 0.05, ***p < 0.001.
Figure 7.
Figure 7.
Serotonergic axons express CatB. A, Spinal cord tissue processed from T8-contused rats that were treated with DMSO vehicle or 22 μg/ml ISP for 7 weeks following injury. At 7 weeks after the last ISP treatment, spinal cord tissue was stained to visualize serotonin (5-HT) and CatB. Scale bar, 500 μm. B, Western blot of injured spinal cord lysates collected from female rats given a thoracic level 8 (T8) contusion and treated with vehicle or 22 μg/ml ISP for 14 d. n = 2.
Figure 8.
Figure 8.
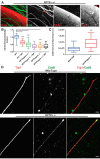
Genetic loss of RPTPσ correlates with CatB activity and CSPG degradation. A, DRGs extracted from RPTPσ+/− animals were cultured on aggrecan spot stained with CS-56 and Tuj1 display digest trails. Arrows point to digested CS-56 left by axon tip. Scale bar, 50 μm. B, CM harvested from BALB/C WT or RPTPσ+/− or −/− animals treated with vehicle or 2.5 μm ISP were incubated onto new aggrecan spots and stained with CS-56 before quantification: n = 100, 56, 51, 32, 63, 64; F(7,52) = 71.6, WT vs ISP, p = 0.0001; WT vs +/−, p = 0.0001; WT vs −/−, p = 0.0001 (ANOVA). C, D, Representative images of CatB in BALB/C WT and RPTPσ−/− DRGs (Tuj1). Scale bar, 20 μm. Quantification of CatB immunoreactivity: n = 45, 30; t = 3.843, df = 30, p = 0.0006 (unpaired t test). Lines indicate median. Boxes represent quartiles. Whiskers indicate range. ***p < 0.001.

Similar articles

Cited by

References

    1. Bai G, Pfaff SL (2011) Protease regulation: the yin and yang of neural development and disease. Neuron 72:9–21. 10.1016/j.neuron.2011.09.012 - DOI - PMC - PubMed
    1. Bijata M, Labus J, Guseva D, Stawarski M, Butzlaff M, Dzwonek J, Schneeberg J, Böhm K, Michaluk P, Rusakov DA, Dityatev A, Wilczyński G, Wlodarczyk J, Ponimaskin E (2017) Synaptic remodeling depends on signaling between serotonin receptors and the extracellular matrix. Cell Rep 19:1767–1782. 10.1016/j.celrep.2017.05.023 - DOI - PubMed
    1. Bolte S, Cordelières FP (2006) A guided tour into subcellular colocalization analysis in light microscopy. J Microsc 224:213–232. 10.1111/j.1365-2818.2006.01706.x - DOI - PubMed
    1. Brittis PA, Canning DR, Silver J (1992) Chondroitin sulfate as a regulator of neuronal patterning in the retina. Science 255:733–736. 10.1126/science.1738848 - DOI - PubMed
    1. Brooks JM, Su J, Levy C, Wang JS, Seabrook TA, Guido W, Fox MA (2013) A molecular mechanism regulating the timing of corticogeniculate innervation. Cell Rep 5:573–581. 10.1016/j.celrep.2013.09.041 - DOI - PMC - PubMed

Publication types

Substances