. 2018 May 30;38(22):5122-5139.
doi: 10.1523/JNEUROSCI.3652-17.2018. Epub 2018 May 14.

Structural and Functional Rescue of Chronic Metabolically Stressed Optic Nerves through Respiration

Affiliations

Structural and Functional Rescue of Chronic Metabolically Stressed Optic Nerves through Respiration

Mohammad Harun-Or-Rashid et al. J Neurosci. .

Abstract

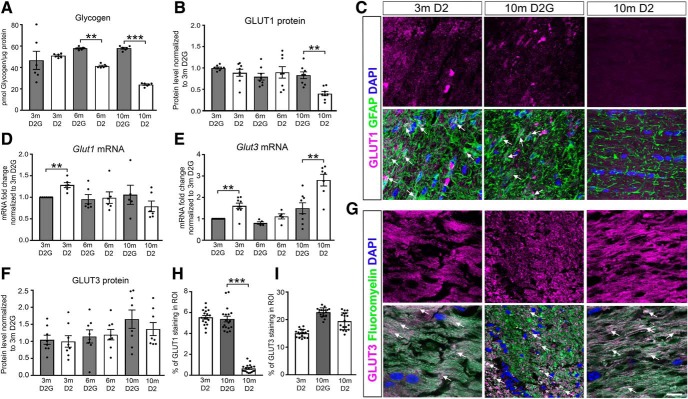
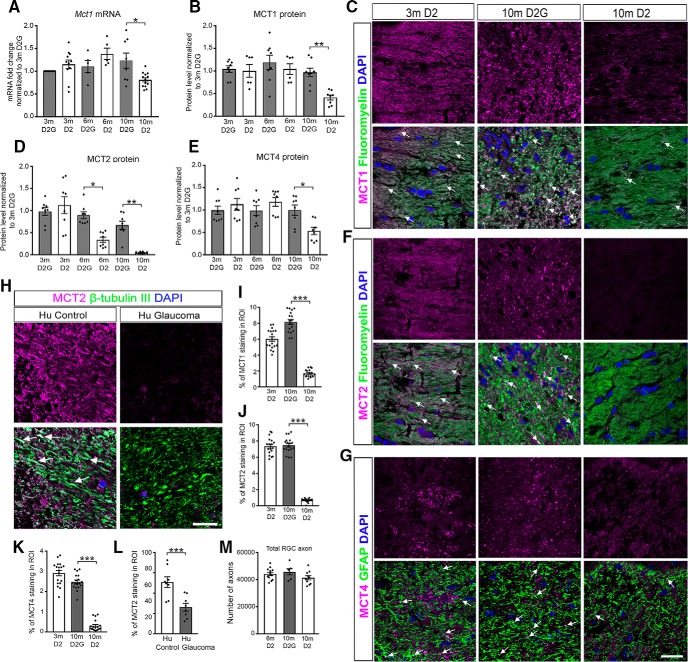
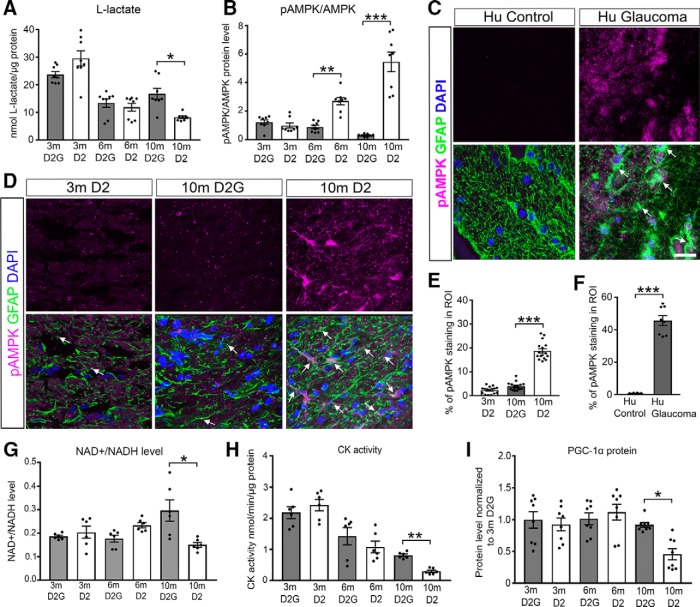
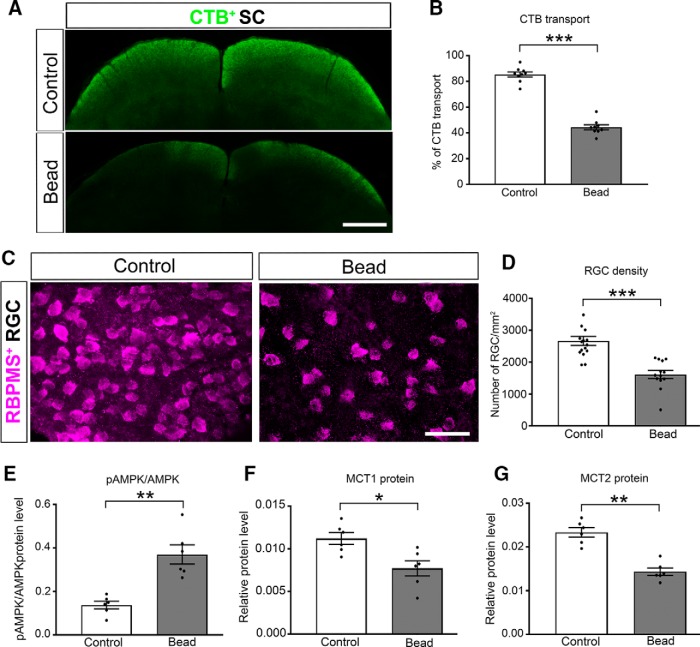
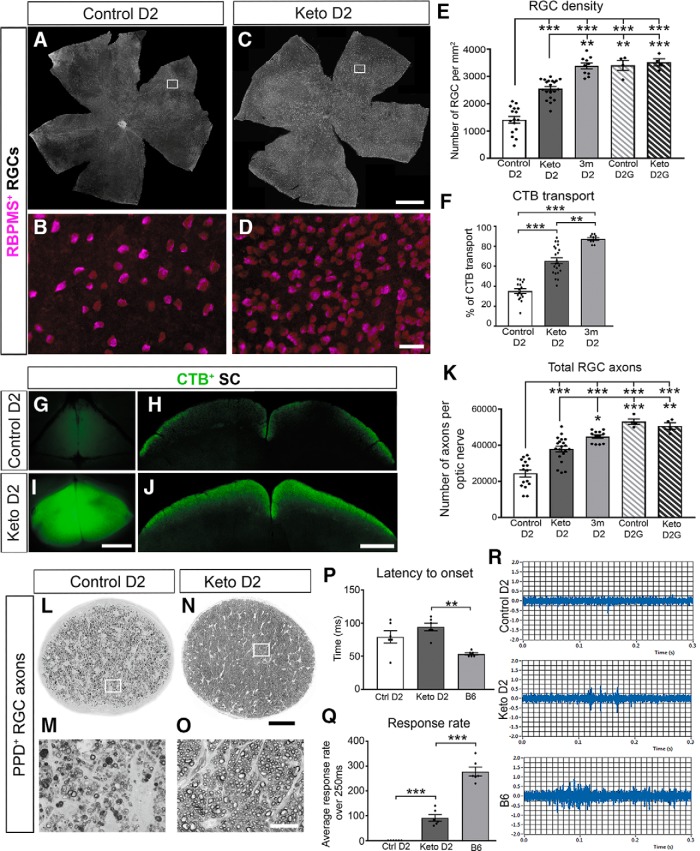
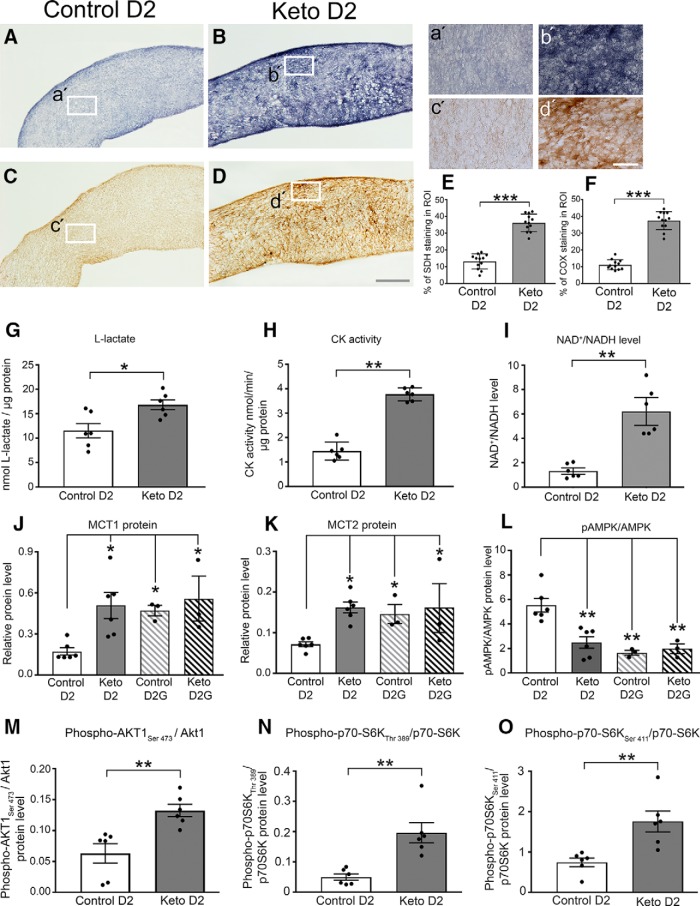
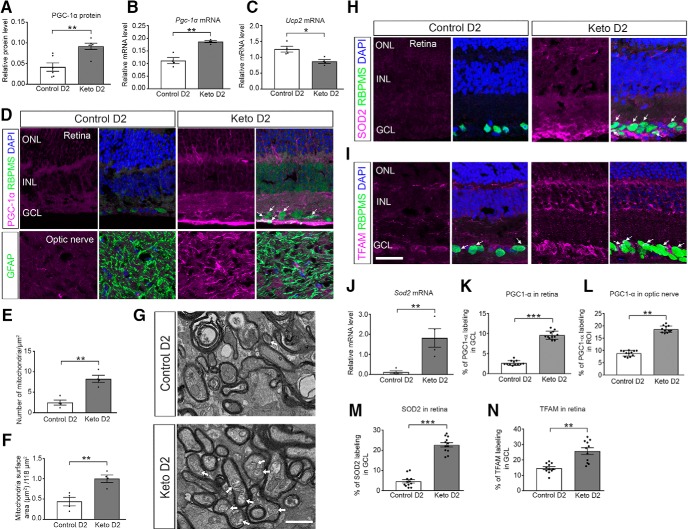
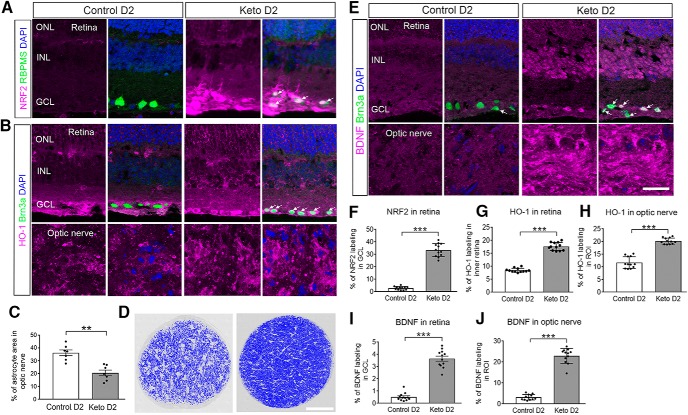
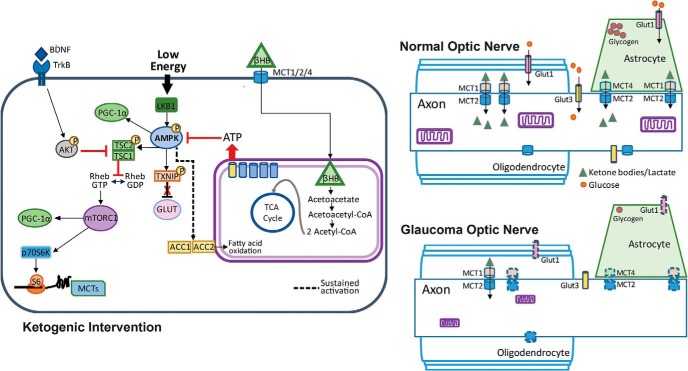
Axon degeneration can arise from metabolic stress, potentially a result of mitochondrial dysfunction or lack of appropriate substrate input. In this study, we investigated whether the metabolic vulnerability observed during optic neuropathy in the DBA/2J (D2) model of glaucoma is due to dysfunctional mitochondria or impaired substrate delivery to axons, the latter based on our observation of significantly decreased glucose and monocarboxylate transporters in D2 optic nerve (ON), human ON, and mice subjected to acute glaucoma injury. We placed both sexes of D2 mice destined to develop glaucoma and mice of a control strain, the DBA/2J-Gpnmb+, on a ketogenic diet to encourage mitochondrial function. Eight weeks of the diet generated mitochondria, improved energy availability by reversing monocarboxylate transporter decline, reduced glial hypertrophy, protected retinal ganglion cells and their axons from degeneration, and maintained physiological signaling to the brain. A robust antioxidant response also accompanied the response to the diet. These results suggest that energy compromise and subsequent axon degeneration in the D2 is due to low substrate availability secondary to transporter downregulation.SIGNIFICANCE STATEMENT We show axons in glaucomatous optic nerve are energy depleted and exhibit chronic metabolic stress. Underlying the metabolic stress are low levels of glucose and monocarboxylate transporters that compromise axon metabolism by limiting substrate availability. Axonal metabolic decline was reversed by upregulating monocarboxylate transporters as a result of placing the animals on a ketogenic diet. Optic nerve mitochondria responded capably to the oxidative phosphorylation necessitated by the diet and showed increased number. These findings indicate that the source of metabolic challenge can occur upstream of mitochondrial dysfunction. Importantly, the intervention was successful despite the animals being on the cusp of significant glaucoma progression.

Keywords: b-hydroxybutyrate; ketogenic diet; neural-glial interaction; optic nerve.


Figures

Figure 1.
Figure 1.
Glycogen and glial glucose transporters decreased with glaucoma pathology. A, Glycogen analysis in 3-, 6-, and 10-month-old D2 and control D2G ONs (n = 6 ONs/group). B, F, Capillary electrophoresis of GLUT1 (B) and GLUT3 (F) protein in 3-, 6-, and 10-month-old D2 and D2G ONs normalized to total protein then to 3-month-old D2G protein levels (n = 8 ONs/group). See Figure 1-1. C, Distribution of GLUT1 in ONs of 3-month-old D2 and 10-month-old D2G and D2 optic nerves immunolabeled with GFAP (green). Arrows indicate colocalization of GLUT1 and GFAP (n = 3 sections/ON, n = 6 ONs/group). D, E, Glut1 and Glut3 mRNA levels in 3-, 6-, and 10-month-old D2 and D2G ONs, normalized to Hprt mRNA then to 3-month-old D2G mRNA (n = 5–7 ONs/group). See Figure 1-1. G, Distribution of GLUT3 in ONs stained with FluoroMyelin. Arrows indicate colocalization of GLUT3 with FluoroMyelin (n = 3 sections/ON, n = 6 ONs/group). H, I, Percentage of mean fluorescence intensity in the ROI for GLUT1 (C) and GLUT3 (G). All values are presented as the mean ± SEM, using one-way ANOVA and Tukey's post hoc test. A, F(5,30) = 18.59, **p = 0.0022, ***p = 0.00011; B, F(5,42) = 6.463, **p = 0.0077; D, F(5,30) = 1.906, **p = 0.001; E, F(5,37) = 15.58, **p = 0.0023, **p = 0.001; H, F(2,51) = 210.4, ***p = 0.0001. Scale bar, C, G, 20 μm.
Figure 2.
Figure 2.
Monocarboxylate transporters downregulated with glaucoma pathology. A, Mct1 mRNA levels in 3-, 6-, and 10-month-old D2 and D2G ONs, normalized to Hprt mRNA then to 3-month-old D2G mRNA (n = 5–13 ONs/group). See Figure 2-1. B, D, E, MCT1, MCT2, and MCT4 protein levels in 3-, 6-, and 10-month-old D2G and D2 ONs, normalized to total protein and then to 3-month-old D2G protein levels (n = 8 ONs/group). C, F, G, Distribution of MCT1 (C), MCT2 (F), and MCT4 (G) in 3-month-old D2 and 10-month-old D2G and D2 ONs stained with FluoroMyelin (green) or immunolabeled with GFAP (green). Arrows indicate colocalization (n = 3 sections/ON, n = 6 ONs/group). H, Distribution of MCT2 in human control and glaucoma patient ONs, immunolabeled for β-tubulin (green) and stained with DAPI (blue). Arrows indicate colocalization (n = 4 sections/ON, n = 2 ONs/group). See Figure 2-1. I–L, Percentage of mean fluorescence intensity in the ROI I, MCT1; J, MCT2; K, MCT4 (D2 and D2G mouse ONs); and L, MCT2, human ON; and (L) MCT2, human ON; and MCT2, human ONs (L). M, Quantification of the total number of RGC axons in 6-month-old D2, 10-month-old D2G, and 10-month-old D2 ONs. All values are presented as the mean ± SEM, one-way ANOVA and Tukey's post hoc test. A, F(5,47) = 4.579, *p = 0.0141; B, F(5,38) = 6.553, **p = 0.0076; D, F(5,42) = 16.14, *p = 0.0054, **p = 0.0013; E, F(5,42) = 4.734, *p = 0.0348; I, F(2,51) = 173.2, ***p = 0.0001; J, F(2,51) = 402.1, ***p = 0.0001; K, F(2,51) = 192.6, ***p = 0.0001; L, t(6) = 9.317, ***p = 0.0001, two-tailed unpaired t test. Scale bars, C, F–H, 20 μm.
Figure 3.
Figure 3.
Low lactate level accompanies AMPK activation and limits mitochondrial biogenesis and metabolic cofactor pools. A, l-lactate levels in 3-, 6-, and 10-month-old D2G and D2 ONs (n = 8 ONs/group). B, Ratio of pAMPK to AMPK protein in 3-, 6-, and 10-month-old D2G and D2 ONs (n = 8 ONs/group). C, D, Phosphorylated AMPK immunofluorescence (magenta) and GFAP (green) micrographs (C) of human control and glaucoma ONs (n = 4 sections/ON, 2 ONs/group); and 3-month-old D2, and 10-month-old D2G and D2 mice (n = 3 sections/ON, 6 ONs/group; D). Arrows indicate colocalization of pAMPK and GFAP. E, F, Percentage of mean fluorescence intensity in the ROI for pAMPK 3-month-old D2, and 10-month-old D2G and D2 mice (E) and humans (F). G–I, Analyses of NAD+/NADH, CK activity, and PGC1-α levels in 3-, 6-, and 10-month-old D2G and D2 mice. G, NAD+ normalized to NADH levels (n = 6 ONs/group). See Figure 3-1. H, Creatine kinase activity normalized to total protein (n = 6 ONs/group). I, PGC1-α protein levels normalized to total protein levels and then to 3-month-old D2G protein levels (n = 8 ONs/group). All values are presented as the mean ± SEM, one-way ANOVA and Tukey's post hoc test. A, F(5,42) = 22.04, *p = 0.0124; B, F(5,42) = 35.51, **p = 0.0032, ***p = 0.0001; E, F(2,45) = 208.4, ***p = 0.0001; F, t(14) = 14.79, ***p = 0.0001, two-tailed unpaired t test; G, F(5,30) = 5.061, *p = 0.0012; H, F(5,48) = 38.28, **p = 0.0025; I F(5,42) = 5.43, *p = 0.0231. Scale bar, C, D, 20 μm.
Figure 4.
Figure 4.
Monocarboxylate transport changes and AMPK activation occur with acute glaucoma injury. A, CTB (green) after intraocular injection from retina to SC of control and bead injected Mito-CFP mice. Dark regions of the superficial, retinorecipient areas of the SC indicate lack of axon transport from the retina. See Figure 4-1. B, Percentage area fraction of CTB transport in SC (n = 10 per group). C, RGCs immunolabeled for the RGC-specific antigen RBPMS in control and bead-injected Mito-CFP mice. D, Quantification of RGC density in control and bead-injected mice (n = 16 control mice; n = 14 bead-injected mice). E–G, Protein analysis by capillary electrophoresis of pAMPK/AMPK (E), MCT1 (F), and MCT2 (G). Proteins normalized to total protein (n = 6 ONs/group). All values are presented as the mean ± SEM, *two-tailed unpaired t test. B, t(16) = 15.07, ***p = 0.0001; D, t(27) = 5.412, ***p = 0.0001; E, t(10) = 4.165, ***p = 0.0019; F, t(10) = 3.114, *p = 0.0110; G, t(10) = 6.536, **p = 0.00110. Scale bars: A, 100 μm; C, 50 μm.
Figure 5.
Figure 5.
Ketogenic diet preserves retinal ganglion cell structure and function. A–E, Flat mount retina immunofluorescence for RGC-specific antigen RBPMS in 11-month-old D2 mice fed a control or ketogenic (keto) diet. A, C, RBPMS+ RGCs in control and keto D2 retina. Scale bar, 500 μm. B, D, High-magnification insets of RBPMS+ RGCs. Scale bar, 50 μm. E, RGC density in D2 and D2G control and keto groups, and 3-month-old D2 mice, quantified from flat mount retinas (n = 16 control D2 mice; n = 20 keto D2 mice; n = 10 3-month-old D2 mice; n = 4 control D2G mice; n = 4 keto D2G mice). F, Percentage area fraction of CTB transported to SC from retina (n = 16 control mice; n = 22 keto mice; 10 3-month-old D2 mice). G–J, Overview and coronal sections of SC showing CTB (green) transport in the control (G, H) and keto (I, J) D2 mouse brains. Scale bars: G, I, 500 μm; H, J, 100 μm. K, Total RGC axon number as quantified in cross sections stained for PPD in control and keto D2 and D2G mice, and 3-month-old D2 ONs (n = 16 control D2 mice; n = 20 keto D2 mice; n = 10 3-month-old D2 mice; n = 4 control D2G mice; n = 4 keto D2G mice). L–O, Optic nerves stained for PPD; (L) control, and (N) keto D2 mice (n=16 control D2 mice; n=22 keto D2 mice) (n = 16 control D2 mice; n = 22 keto D2 mice; N). Scale bar, 100 μm. M, O, Magnified view of insets in L and N, respectively. Scale bar, 0.25 μm. P, Q, Latency to onset of activity (P) and average response rate (Q) to light flash over the first 250 ms of activity as measured by tungsten electrode in control, keto, and C57BL/6 (B6) SCs (n = 6 for each group; n = 3 sites/SC). No activity was detected in the control diet mouse SC. R, Example spike activity traces for Control D2 (top), Keto D2 (middle), and B6 (bottom) SCs; the first 300 ms are shown. All values are presented as the mean ± SEM, one-way ANOVA and Tukey's post hoc test. E: F(4,49) = 53.92, **p = 0.0026, ***p = 0.0001, control D2 vs keto D2G, ***p = 0.0005; F: F(2,45) = 72.04, **p = 0.00106, ***p = 0.0001; K: F(4,51) = 32.33, *p = 0.0284, ***p = 0.0001, keto D2 vs control D2G, ***p = 0.0005, control D2 vs keto D2G, **p = 0.0042; P: F(2,15) = 10.17, **p = 0.0013; Q: F(2,15) = 120.9, ***p = 0.0001.
Figure 6.
Figure 6.
Ketogenic diet increases mitochondrial respiration, restores monocarboxylate transporters, reduces AMPK pathway activation, and activates the AKT—mTOR–p70S6K signaling pathway. A, a, SDH histochemistry of control diet-fed D2 ONs (A) and high-magnification inset (a). B, b, SDH histochemistry of ketogenic diet-fed D2 ONs (B) and high-magnification inset (b). C, c, COX histochemistry of control D2 ONs and high-magnification inset (c). D, d, COX histochemistry of a ketogenic D2 ON and high-magnification inset (d). E, Quantification of SDH histochemistry as shown in A and B (n = 4 ONs/group, n = 3 sections/nerve). F, Quantification of COX histochemistry as shown in C and D (n = 4 ONs/group, n = 4 sections/nerve). G, l-lactate in control and keto D2 ONs (n = 6/group). H, CK activity in control and keto D2 ONs (n = 6/group). I, NAD+/NADH ratio in control and keto D2 ONs (n = 6/group). G–I, Values normalized to total protein. J–O, Capillary electrophoresis protein analysis in control and keto D2 and D2G ONs (n = 6/group), all normalized to total protein. J, MCT1 protein. K, MCT2 protein. L, Ratio of phosphorylated AMPK to AMPK protein. M, Ratio of phosphorylated AKT1Ser 473 to AKT1. N, Ratio of p70S6KThr 389 to p70S6K protein. O, Ratio of p70S6KSer 411 to p70S6K protein. See Figure 5-1 and Figure 6-1. All values are presented as the mean ± SEM, two-tailed unpaired t test, and one-way ANOVA and Tukey's post hoc test. E: t(22) = 11.65, ***p = 0.0001; F: t(22) = 14.78, ***p = 0.0001; G: t(11) = 3.354, *p = 0.0064; H: t(10) = 12.5, **p = 0.00101; I: t(10) = 6.20325, **p = 0.0013; J: F(3,14) = 4.751, control D2 vs keto D2, *p = 0.0291, control D2 vs control D2G, *p = 0.0461, control D2 vs keto D2G, *p = 0.420; K, F(3,14) = 4.354, control D2 vs keto D2, *p = 0.0270, control D2 vs control D2G, *p = 0.0356, control D2 vs keto D2G, **p = 0.043; L, F(3,14) = 12.81, control D2 vs keto D2 **p = 0.0015, control D2 vs control D2G, **p = 0.0011, control D2 vs keto D2G, **p = 0.0023; M: t(10) = 3.72, **p = 0.004; N: t(10) = 4.232, **p = 0.0017; O: t(10) = 3636, **p = 0.0046. Scale bars: D (for A–D), 100 μm; d (for a to d), 20 μm.
Figure 7.
Figure 7.
Ketogenic diet upregulates mitochondrial biogenesis and antioxidant response. A, B, PGC-1α protein (n = 6 per group; A) and Pgc1a mRNA (B) in control diet and keto D2 ONs (n = 4/group). C, Ucp2 mRNA levels in control diet and keto D2 ONs (n = 4/group). D, PCG-1α immunofluorescence (magenta) in retina (top panels; RGC marker RBPMS in green) and ON (bottom panels; astrocyte marker GFAP in green). Arrows indicate RGC somata ringed with PGC-1α labeling. E, F, Mitochondrial number (E) and mitochondrial surface area (F) in RGC axons within the ON (n = 4 ONs/group). G, Electron micrographs of control and keto D2 ONs. Arrows indicate mitochondria. H, SOD2 immunofluorescence in control diet and keto D2 retinas. Arrows indicate colocalization of SOD2 with RBPMS. I, TFAM immunofluorescence in control diet and keto D2 retina. Arrows indicate colocalization of TFAM with RBPMS. J, Sod2 mRNA levels in control diet and keto D2 ONs (n = 4/group). Quantification of immunolabeling K, PGC-1α in ganglion cell layer (GCL) of retina. L, PGC-1α in proximal myelinated ON. M, SOD2 in GCL of retina; N, TFAM in GCL of retina. All values are presented as the mean ± SEM, two-tailed unpaired t test. A: t(10) = 3.917, **p = 0.0029; B: t(6) = 5.938, **p = 0.0010; C: t(6) = 3.569, *p = 0.0118; E: t(6) = 5.332, **p = 0.0018; F: t(6) = 4.007, **p = 0.0071; J: t(6) = 5.515, **p = 0.0105; K: t(22) = 20.41, ***p = 0.0001; L: t(22) = 19.28, **p = 0.001; M: t(22) = 13.13, ***p = 0.0001; N: t(20) = 4.809, **p = 0.0018. Scale bar, I (for D, H, I), 20 μm.
Figure 8.
Figure 8.
Ketogenic diet upregulates antioxidant response, limits glial hypertrophy, and upregulates BDNF. A, NRF2 immunofluorescence (magenta) in control diet and keto D2 retinas. Arrows indicate somata in which Nrf2 has translocated to the nucleus of RGCs labeled with RBPMS (green). B, HO-1 (magenta) and Brn3a (green) immunofluorescence in control diet and keto D2 retina and ON (n = 4/group). C, Astrocyte hypertrophy analysis in ON cross sections from control and keto D2 mice. D, Examples of thresholding used to calculate area of astrocyte hypertrophy in control (left) and ketogenic diet (right) ONs. Scale bar, 100 μm. Dark blue areas are intact axons; light areas are astrocytes. E, BDNF (magenta) immunofluorescence in control diet and keto D2 retinas also immunolabeled for Brn3a for RGCs (green) and ONs. Arrows and white color indicate colocalization of BDNF with Brn3a. F–I, Percentage of immunolabeling by ROI across analysis depicted in A, B, and E. Analysis was undertaken in three sections per tissue, with four retinas or ONs per group. F, NRF2 in GCL of retina. G, HO-1 in inner retina. H, HO-1 in proximal myelinated ON. I, BDNF in GCL of retina. J, BDNF in proximal myelinated ON. All values are presented as the mean ± SEM, two-tailed unpaired t test. C: t(12) = 4.983, **p = 0.003; F: t(22) = 19.56, ***p = 0.0001; G: t(22) = 18.65, ***p = 0.0001; H: t(22) = 11.38, ***p = 0.0001; I: t(22) = 13.93, ***p = 0.0001; J: t(22) = 18.01, ***p = 0.0001. Scale bar, E (for A, B and E), 20 μm.
Figure 9.
Figure 9.
Glucose and monocarboxylate transporter complement in optic nerve, and intracellular pathways regulating the response to low energy and ketogenic diet. Right, Top, Normal optic nerve showing mitochondria within the axon, and glycogen storage in the astrocyte contacting the axonal node of Ranvier. The glucose transporters GLUT1 (on astrocytes and oligodendrocytes) and GLUT3 (on axons) are distributed across their respective cells. The monocarboxylate transporters (MCT2 on axons, MCT1 on oligodendrocytes, and MCT1 and MCT4 on astrocytes) display kinetics that favor the movement of ketone bodies and lactate from the glia to the neurons. Right, Bottom, Glaucomatous optic nerve shows a reduction in mitochondria size (Coughlin et al., 2015), as well as decreased GLUT1 and MCT1, MCT2, and MCT4 transporters (denoted by dashed outlines). Left, Low energy levels lead to the activation of AMPK and the subsequent upregulation of PGC-1α and activation of TXNIP, thereby relieving the constitutive degradation of GLUT1. Activated (phosphorylated) AMPK also phosphorylates TCS2, thereby blocking the conversion of Rheb-GDP to Rheb-GTP and preventing the activation of the mTORC1. Sustained activation of AMPK upregulates ACC1 and ACC2, promoting fatty acid oxidation. Fatty acid oxidation and utilization of βHB provides ATP, thereby blocking AMPK activation. When not active, AMPK no longer blocks mTORC1 activity, allowing the activation of p70S6K, the phosphorylation of S6, and the subsequent translation of proteins such as MCT2. TXNIP, Thioredoxin-interacting protein; TCS2, tuberous sclerosis complex 2; ACC, acetyl-CoA carboxylase.

Similar articles

Cited by

References

    1. Anderson MG, Smith RS, Hawes NL, Zabaleta A, Chang B, Wiggs JL, John SW (2002) Mutations in genes encoding melanosomal proteins cause pigmentary glaucoma in DBA/2J mice. Nat Genet 30:81–85. 10.1038/ng794 - DOI - PubMed
    1. Anson RM, Guo Z, de Cabo R, Iyun T, Rios M, Hagepanos A, Ingram DK, Lane MA, Mattson MP (2003) Intermittent fasting dissociates beneficial effects of dietary restriction on glucose metabolism and neuronal resistance to injury from calorie intake. Proc Natl Acad Sci U S A 100:6216–6220. 10.1073/pnas.1035720100 - DOI - PMC - PubMed
    1. Araki T, Sasaki Y, Milbrandt J (2004) Increased nuclear NAD biosynthesis and SIRT1 activation prevent axonal degeneration. Science 305:1010–1013. 10.1126/science.1098014 - DOI - PubMed
    1. Baltan S, Inman DM, Danilov CA, Morrison RS, Calkins DJ, Horner PJ (2010) Metabolic vulnerability disposes retinal ganglion cell axons to dysfunction in a model of glaucomatous degeneration. J Neurosci 30:5644–5652. 10.1523/JNEUROSCI.5956-09.2010 - DOI - PMC - PubMed
    1. Beckett TL, Studzinski CM, Keller JN, Paul Murphy M, Niedowicz DM (2013) A ketogenic diet improves motor performance but does not affect β-amyloid levels in a mouse model of Alzheimer's disease. Brain Res 1505:61–67. 10.1016/j.brainres.2013.01.046 - DOI - PMC - PubMed

Publication types

MeSH terms

Substances

LinkOut - more resources