. 2018 Jul 1;201(1):157-166.
doi: 10.4049/jimmunol.1701501. Epub 2018 May 14.

Neuron-Specific HuR-Deficient Mice Spontaneously Develop Motor Neuron Disease

Affiliations

Neuron-Specific HuR-Deficient Mice Spontaneously Develop Motor Neuron Disease

Kevin Sun et al. J Immunol. .

Erratum in

Abstract

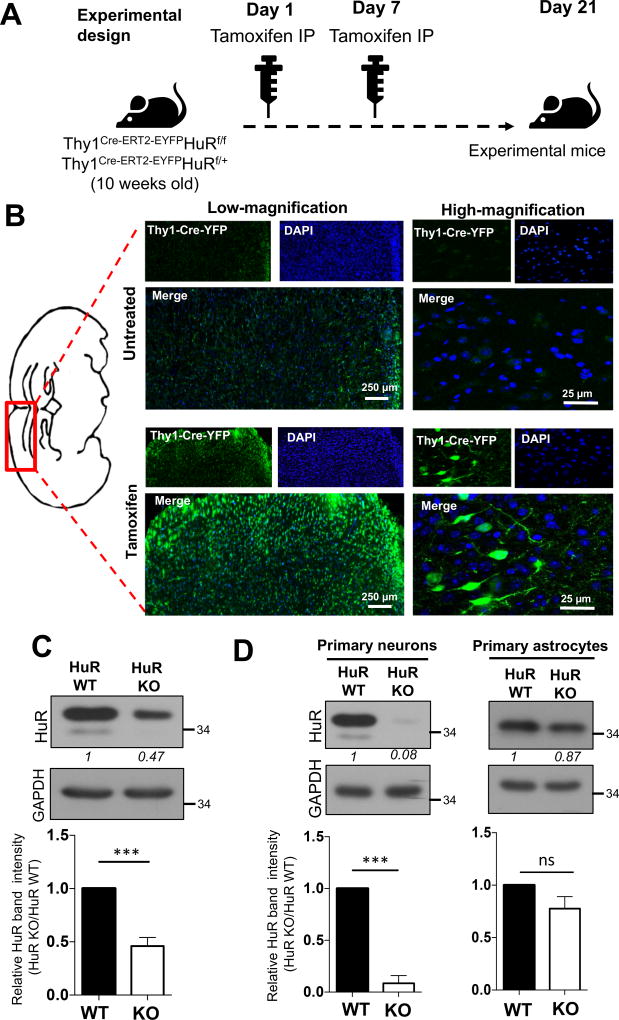
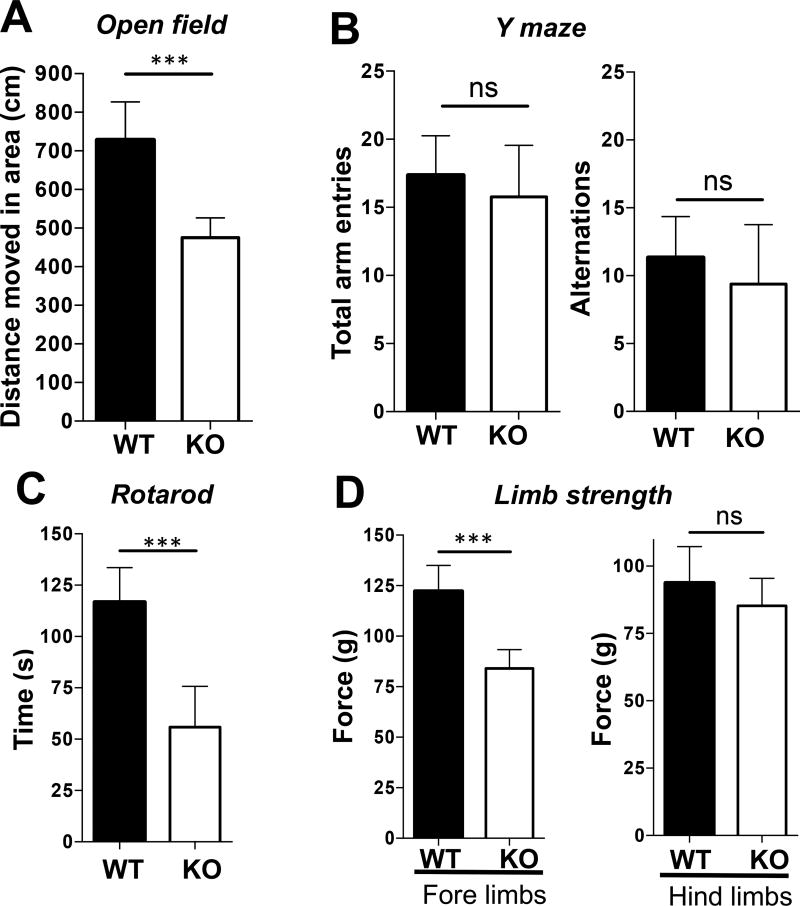
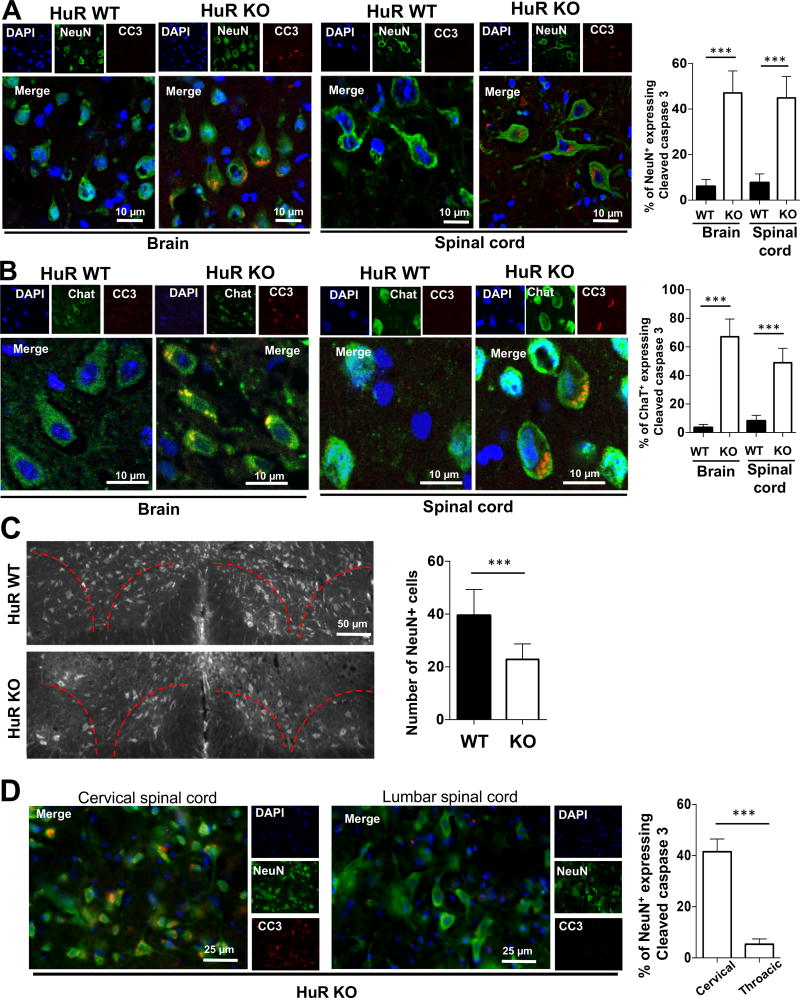
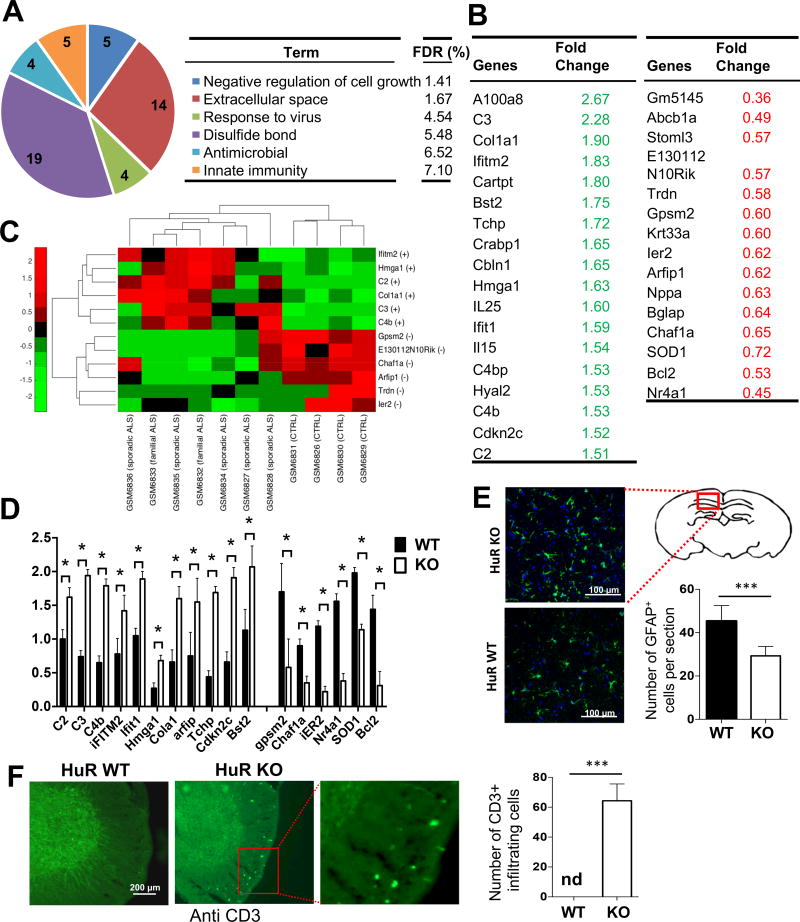
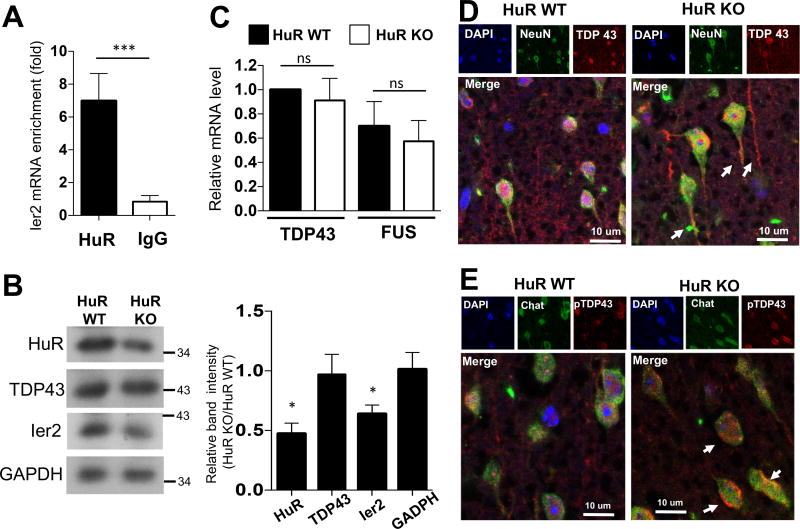
Human Ag R (HuR) is an RNA binding protein in the ELAVL protein family. To study the neuron-specific function of HuR, we generated inducible, neuron-specific HuR-deficient mice of both sexes. After tamoxifen-induced deletion of HuR, these mice developed a phenotype consisting of poor balance, decreased movement, and decreased strength. They performed significantly worse on the rotarod test compared with littermate control mice, indicating coordination deficiency. Using the grip-strength test, it was also determined that the forelimbs of neuron-specific HuR-deficient mice were much weaker than littermate control mice. Immunostaining of the brain and cervical spinal cord showed that HuR-deficient neurons had increased levels of cleaved caspase-3, a hallmark of cell apoptosis. Caspase-3 cleavage was especially strong in pyramidal neurons and α motor neurons of HuR-deficient mice. Genome-wide microarray and real-time PCR analysis further indicated that HuR deficiency in neurons resulted in altered expression of genes in the brain involved in cell growth, including trichoplein keratin filament-binding protein, Cdkn2c, G-protein signaling modulator 2, immediate early response 2, superoxide dismutase 1, and Bcl2. The additional enriched Gene Ontology terms in the brain tissues of neuron-specific HuR-deficient mice were largely related to inflammation, including IFN-induced genes and complement components. Importantly, some of these HuR-regulated genes were also significantly altered in the brain and spinal cord of patients with amyotrophic lateral sclerosis. Additionally, neuronal HuR deficiency resulted in the redistribution of TDP43 to cytosolic granules, which has been linked to motor neuron disease. Taken together, we propose that this neuron-specific HuR-deficient mouse strain can potentially be used as a motor neuron disease model.


Figures

Fig. 1
Fig. 1. Generation of neuron-specific HuR-deficient mice
A. Tamoxifen was administered to conditional neuron–specific HuR-deficient (Thy1Cre-ERT2-EYFPHuRf/f) and age-matched control (Thy1Cre-ERT2-EYFPHuRf/+) mice at 10 and 11 weeks of age. Three weeks (21 days) after first tamoxifen injection, these mice (referred as experimental mice) were subjected to the experiments in Fig. 1B-C and Fig. 2 A–D. B. The representative confocal images of Cre-YFP in brain sections of neuron–specific HuR-deficient (Thy1Cre-ERT2-EYFPHuRf/f) mice either untreated or treated with tamoxifen as in A, Nuclei were stained with DAPI (blue). C. Western blot analysis of HuR in lysates from brain tissue of neuron–specific HuR-deficient (Thy1Cre-ERT2-EYFPHuRf/f) and control (Thy1Cre-ERT2-EYFPHuRf/+) mice after tamoxifen injection. Western blots were quantified by densitometry using ImageJ, error bars represent s.d. of biological replicates (N=15 mice for both KO and WT), ***p<0.05 by two-tailed Student’s t test. D. Western blot analysis of HuR in lysates from tamoxifen treated primary neurons and astrocytes isolated from HuR-deficient (Thy1Cre-ERT2-EYFPHuRf/f) and control (Thy1Cre-ERT2-EYFPHuRf/+) mice. Western blots were quantified by densitometry using ImageJ, error bars represent s.d. of biological replicates (N=15 mice for both KO and WT), ***p<0.001 by two-tailed Student’s t test.
Fig. 2
Fig. 2. Neuron-specific HuR-deficient mice show impaired motor coordination and grip strength
A–B. Experimental neuron–specific HuR-deficient and age-matched control mice as described in Fig. 1A were subjected either to an open field behavioral test for 15 minutes (A) or a Y-maze test for 15 minutes (B). N=15 mice per group. Error bars represent s.d. of biological replicates. ***p<0.001 by by two-tailed Student’s t test. C. Motor performance of experimental neuron–specific HuR-deficient and control mice as described in Fig. 1A was compared by a rotarod test with a rod (3 cm in diameter) starting at an initial rotation of 4 rpm and accelerating to 40 rpm over 5 min. Mice were tested for time spent on the rod during each of four trials with a 30 min. inter-trial interval. Each trial was completed when the mouse fell off of the rod. N=15 mice per group. Error bars represent s.d. of biological replicates. ***p<0.001 by by two-tailed Student’s t test. D. Five successful forelimb and hindlimb strength measurements within 2 minutes per mouse were performed. Tests was repeated twice with a 1 week rest period. N=15 mice per group. Error bars represent s.d. of biological replicates. ***p<0.001 by by two-tailed Student’s t test. Please provide scale bars for the applicable photos in each figure.
Fig. 3
Fig. 3. Neuron-specific HuR-deficient mice display degeneration of cortical and spinal motor neurons
A–B. The representative confocal images of either NeuN (green) and cleaved caspase 3 (red) double staining (A) or ChaT (green) and cleaved caspase 3 (red) double staining (B) in sections of primary motor cortex in brain and ventral horn of cervical spinal cord of experimental neuron-specific HuR-deficient and control mice as described in Fig. 1A. Nuclei were stained with DAPI (blue). The percentages of neurons that were caspase 3-positive over NeuN-positive were quantified for brain and spinal cord sections, respectively. N=15 mice per group and 5 sections per mouse were analyzed. Error bars represent s.d. of biological replicates. ***p<0.001 by Mann–Whitney test. C. The representative fluorescent images of NeuN staining indicated the significant reduction of NeuN positive cells (~40%) in cervical spinal cord (Layers VIII and IX) of experimental neuron-specific HuR-deficient than control mice. The number of neurons in the ventral horn of the spinal cord was quantified by counting NeuN-positive cells. N=15 mice per group and 5 sections per mouse were analyzed. Error bars represent s.d. of biological replicates. ***p<0.001 by Mann–Whitney test. D. The representative fluorescent images of NeuN (green) and cleaved caspase 3 (red) double staining in cervical and lumbar spinal cord of experimental neuron-specific HuR-deficient and control mice as described in Fig. 1A. Nuclei were stained with DAPI (blue). N=15 mice per group and 5 sections per mouse were analyzed. Error bars represent s.d. of biological replicates. ***p<0.001 by Mann–Whitney test.
Fig. 4
Fig. 4. Microarray analysis of brain tissue from neuron-specific HuR-deficient mice
A. RNA samples from whole brain tissue of three pairs of experimental neuron-specific HuR-deficient mice and littermate control mice were analyzed on Affymetrix Mouse Gene 2.0 ST arrays. Differentially up- and down-regulated genes (>1.5-fold) were subjected to Ontology (GO) enrichment analysis. The significantly enriched (False Discovery Rate (FDR)<10%) GO terms and the numbers of pathway-associated genes are shown. B. Lists of selected differentially expressed transcripts identified by microarray analysis as described in Fig. 4A. C. Heatmap showing the level of expression of the selected transcripts in ALS patients and controls, which were differentially expressed between neuron-specific HuR-deficient and control mice. The plus (+) and minus (-) signs represent up- and down-regulation of transcripts, respectively. The expression profile was standardized along the row for better visualization. The red and green colors indicate high and low expression, respectively. D. Real-time PCR analysis of the selected transcripts (identified in microarray analysis) was performed for RNA samples from brain tissue of experimental neuron-specific HuR-deficient mice and littermate control mice. N=15 mice per group. Error bars represent s.d. of biological replicates. ***P<0.001 by by two-tailed Student’s t test. E. The representative confocal images of GFAP (green) staining in brain sections of experimental neuron-specific HuR-deficient and control mice as described in Fig. 1A. Nuclei were stained with DAPI (blue). Bar graph shows the number of GFAP-positive cells per section. N=15 mice per group and 5 sections per mouse were analyzed. Error bars represent s.d. of biological replicates. ***p<0.001 by Mann–Whitney test. F. Anti-CD3 stained thoracic spinal cord sections of experimental neuron-specific HuR-deficient and control mice as described in Fig. 1A. N=15 mice per group and 5 sections per mouse were analyzed. Error bars represent s.d. of biological replicates. ***p<0.001 by Mann–Whitney test.
Fig. 5
Fig. 5. Neuron-specific HuR-deficient mice display a molecular signature consistent with ALS
A. Lysates of NSC-34 cells were subjected to RNA immunoprecipitation with anti-HuR or anti-IgG antibody, followed by RT-PCR analysis of Ier2 mRNA. Error bars represent s.d. of biological replicates (N=15 mice for both KO and WT). ***p<0.001, by two-tailed unpaired Student’s t test. B. Whole brain extracts from experimental neuron-specific HuR-deficient and control mice as described in Fig. 1A were analyzed by Western blotting with the indicated antibodies. Western blots were quantified by densitometry using ImageJ, error bars represent s.d. of biological replicates (N=15 mice for both KO and WT), ***P<0.001 by two-tailed Student’s t test. C. Real-time PCR analysis of TDP-43 and FUS mRNA in RNA samples from whole brain tissue of experimental neuron-specific HuR-deficient and control mice. Error bars represent s.d. of biological replicates (N=15 mice for both KO and WT). ***p<0.001, by two-tailed unpaired Student’s t test. D–E. The representative confocal images of either NeuN (green) and TDP-43 (red) (D) or ChaT (green) and phospho-TDP-43 (red) (E) double staining in brain sections of experimental neuron-specific HuR-deficient and control mice. Nuclei were stained with DAPI (blue).

Similar articles

Cited by

References

    1. Taylor JP, Brown RH, Jr, Cleveland DW. Decoding ALS: from genes to mechanism. Nature. 2016;539:197–206. - PMC - PubMed
    1. Zarei S, Carr K, Reiley L, Diaz K, Guerra O, Altamirano PF, Pagani W, Lodin D, Orozco G, Chinea A. A comprehensive review of amyotrophic lateral sclerosis. Surg. Neurol. Int. 2015;6 - PMC - PubMed
    1. Petrov D, Mansfield C, Moussy A, Hermine O. ALS Clinical Trials Review: 20 Years of Failure. Are We Any Closer to Registering a New Treatment? Front. Aging Neurosci. 2017;9 - PMC - PubMed
    1. Xu Z-S. Does a loss of TDP-43 function cause neurodegeneration? Mol. Neurodegener. 2012;7:27. - PMC - PubMed
    1. Brennan CM, Steitz JA. HuR and mRNA stability. Cell. Mol. Life Sci. CMLS. 2001;58:266–277. - PMC - PubMed

Publication types