. 2018 May 14;9(1):1888.
doi: 10.1038/s41467-018-04089-9.

Aurora A-dependent CENP-A phosphorylation at inner centromeres protects bioriented chromosomes against cohesion fatigue

Affiliations

Aurora A-dependent CENP-A phosphorylation at inner centromeres protects bioriented chromosomes against cohesion fatigue

Grégory Eot-Houllier et al. Nat Commun. .

Abstract

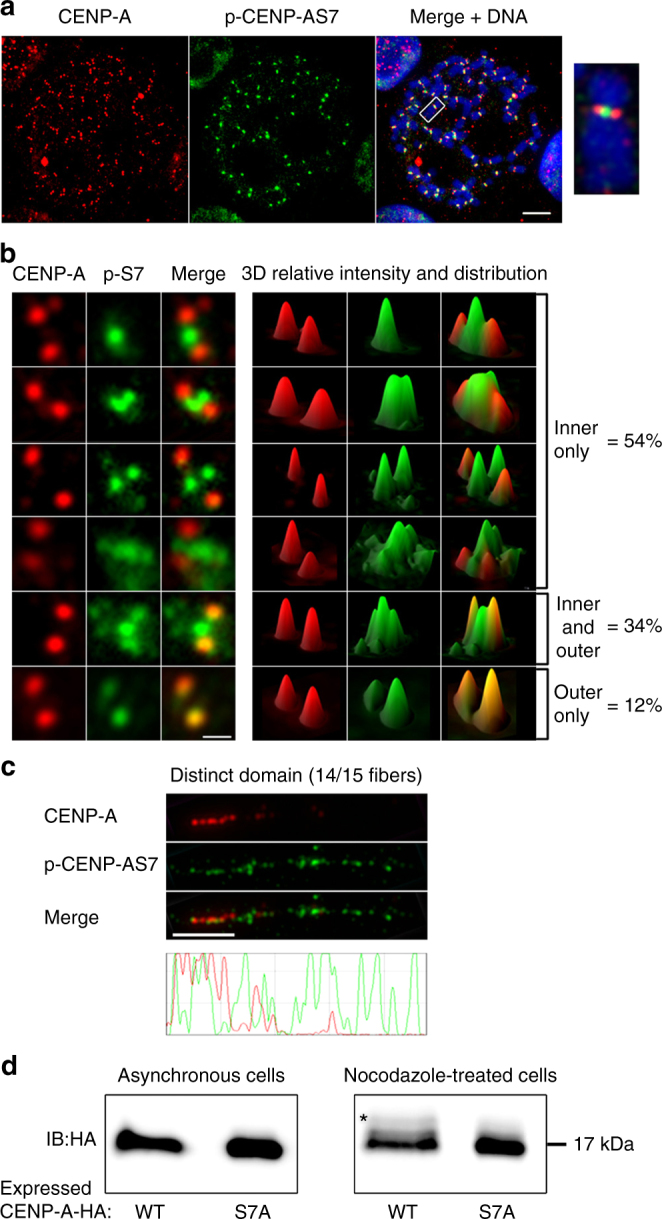
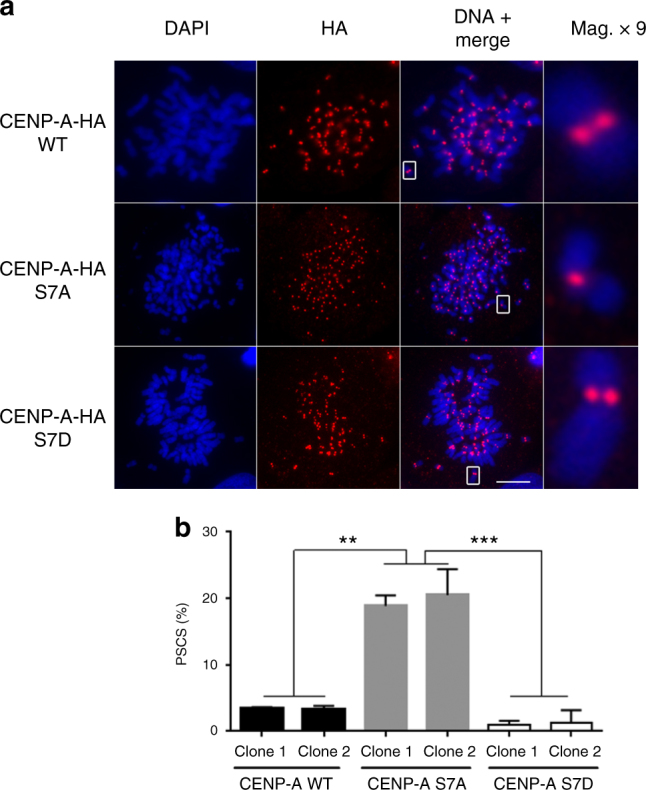
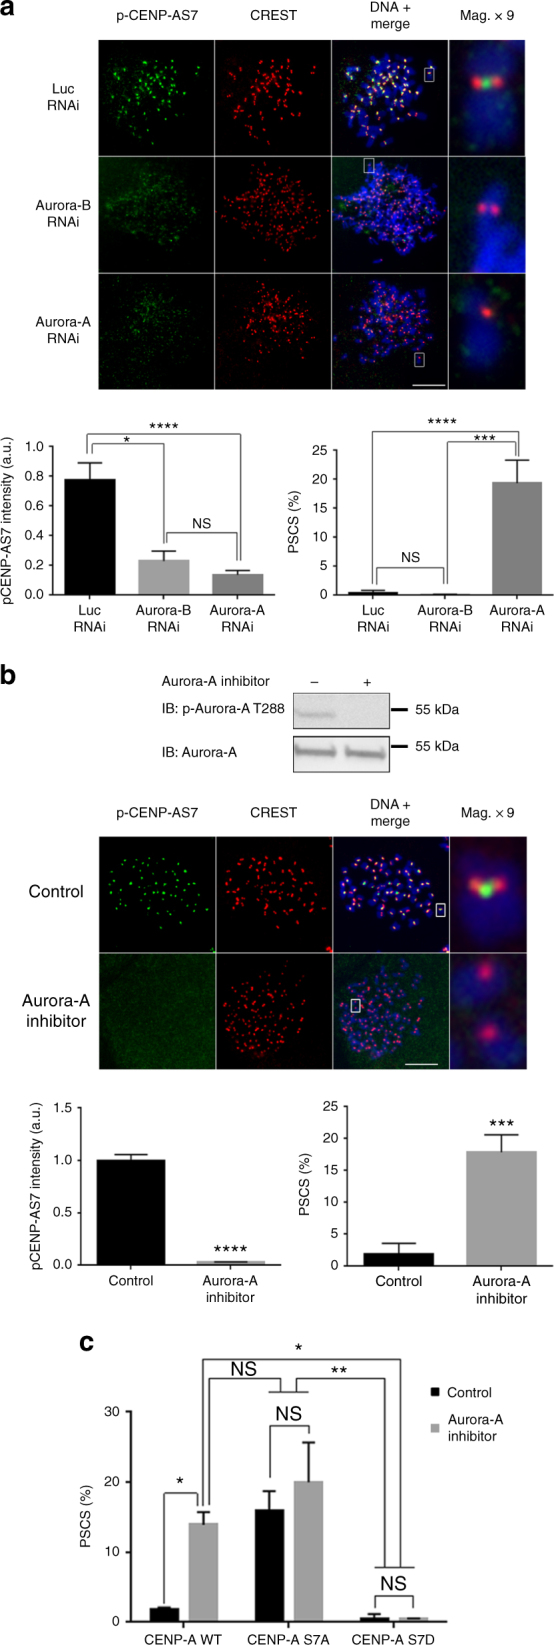
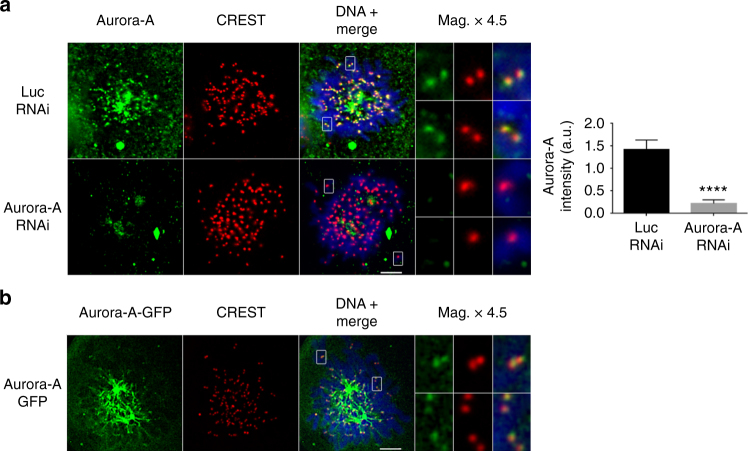
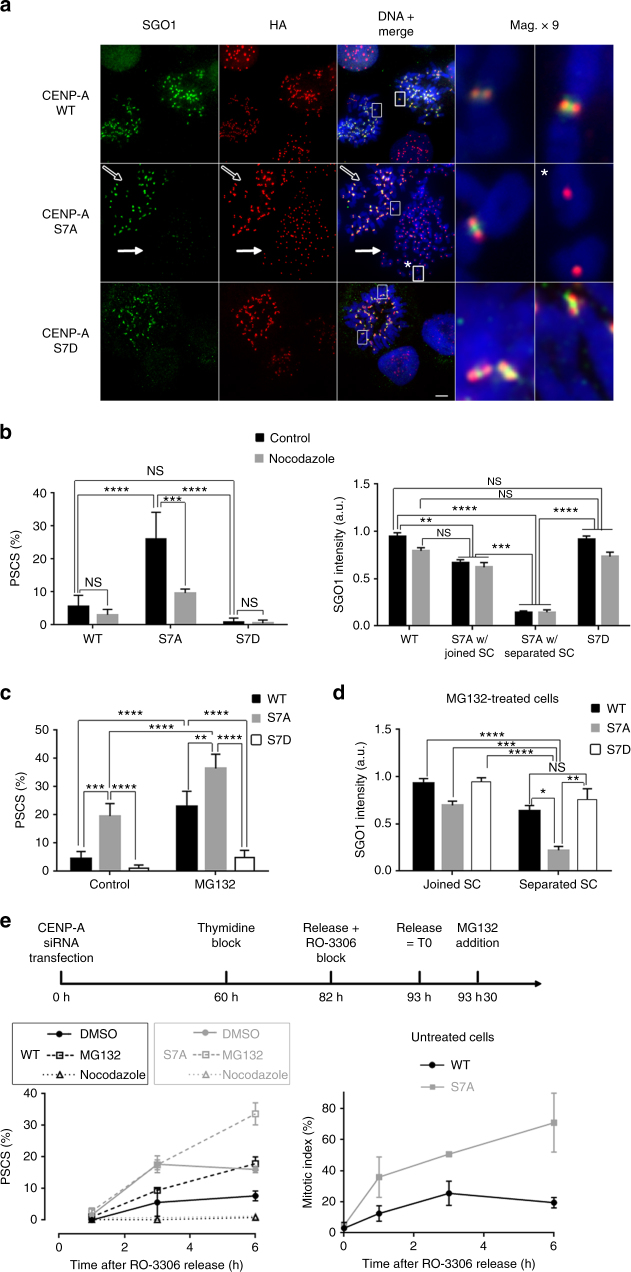
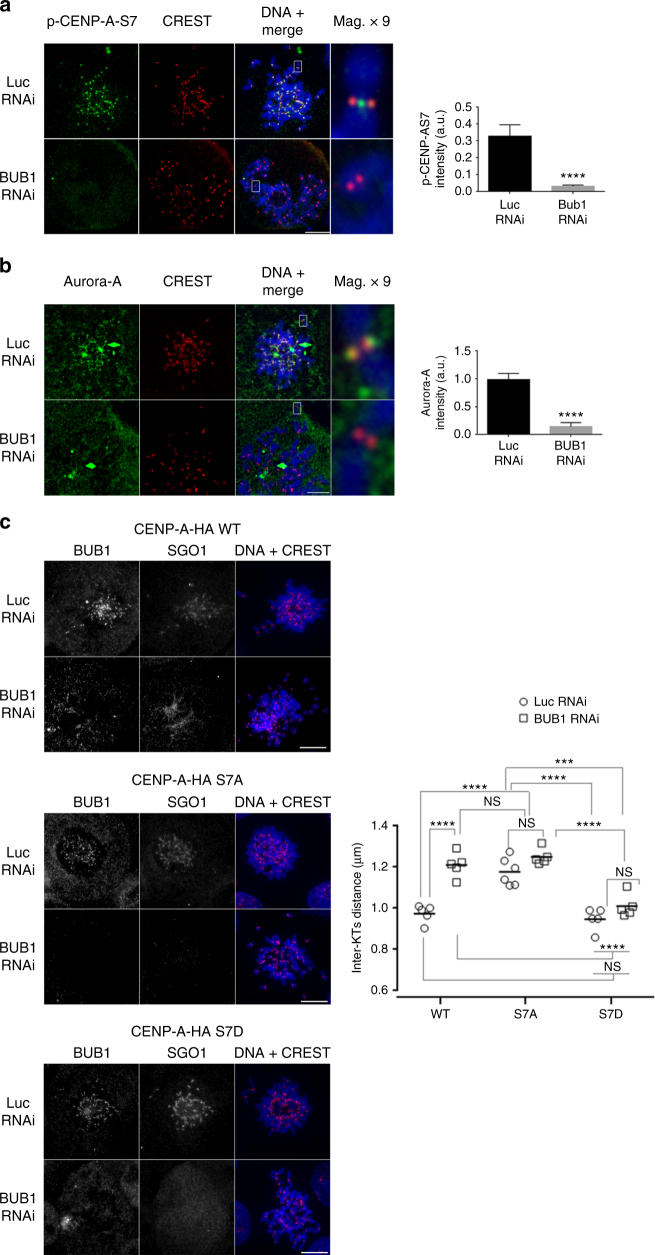
Sustained spindle tension applied to sister centromeres during mitosis eventually leads to uncoordinated loss of sister chromatid cohesion, a phenomenon known as "cohesion fatigue." We report that Aurora A-dependent phosphorylation of serine 7 of the centromere histone variant CENP-A (p-CENP-AS7) protects bioriented chromosomes against cohesion fatigue. Expression of a non-phosphorylatable version of CENP-A (CENP-AS7A) weakens sister chromatid cohesion only when sister centromeres are under tension, providing the first evidence of a regulated mechanism involved in protection against passive cohesion loss. Consistent with this observation, p-CENP-AS7 is detected at the inner centromere where it forms a discrete domain. The depletion or inhibition of Aurora A phenocopies the expression of CENP-AS7A and we show that Aurora A is recruited to centromeres in a Bub1-dependent manner. We propose that Aurora A-dependent phosphorylation of CENP-A at the inner centromere protects chromosomes against tension-induced cohesion fatigue until the last kinetochore is attached to spindle microtubules.


Conflict of interest statement

The authors declare no competing interests.

Figures

Fig. 1
Fig. 1
Serine 7-phosphorylated CENP-A (p-CENP-AS7) localizes to the inner side of centromeres during mitosis. a Immunofluorescence on metaphase chromosome spreads from HeLa-S3 cells, double-stained with anti-CENP-A and anti-p-CENP-AS7 antibodies. Merged image with DAPI staining (blue), scale bar = 10 µm. Magnification × 7.5 of a single chromosome. b Distribution of p-CENP-AS7 (green) and CENP-A (red) at centromeres. Left panels: different patterns of immunofluorescence signals with p-CENP-AS7 on the inner side only, on both the inner and outer sides and on the outer side only; right panels: 3D views of p-CENP-AS7 (green) and CENP-A (red) signals. Scale bar = 1 µm. In total, 520 chromosomes from 3 independent experiments were scored and the percentages of chromosomes with p-CENP-AS7 on the inner and/or outer side of the centromere are indicated on the right. c CENP-A and p-CENP-AS7 localize to different domains on mitotic stretched chromatin fibers. Extended chromatin fibers were prepared from HeLa-S3 cells blocked in mitosis by overnight nocodazole treatment; CENP-A (red) and p-CENP-AS7 (green) signals on a representative centromere chromatin fiber are shown. The lower panel shows the profile of signals along the length of the fiber. Scale bar = 5 µm. d Only a small amount of CENP-A displays serine 7 phosphorylation during mitosis. HeLa cell lines stably expressing CENP-A-WT-HA and CENP-A-S7A-HA were left untreated (left panel) or were treated overnight with nocodazole (right panel). Protein extracts were separated on a 20% polyacrylamide (29:1 acrylamide/bisacylamide) gel and immunoblotted with an anti-HA antibody. The shift due to phosphorylation is indicated by an asterisk. Three independent experiments were performed
Fig. 2
Fig. 2
CENP-A-S7P is required for the protection of sister chromatid cohesion during mitosis. a After endogenous CENP-A siRNA depletion, metaphase chromosome spreads from CENP-A-HA-WT, CENP-A-HA-S7A, or CENP-A-HA-S7D cell lines were immunostained with an anti-HA antibody. A × 9 magnification of a single chromosome is shown. Scale bar = 5 µm. b Mitotic cells displaying premature sister chromatid separation (PSCS) were quantified with two different clones from each cell line; at least 1000 cells were counted for each data point. The data shown are the mean ± SD (n = 3 experiments; **P<0.01, ***P<0.001, one-way ANOVA)
Fig. 3
Fig. 3
Aurora A is involved in sister chromatid cohesion. a After transfection with a siRNA against Aurora A or Aurora B, chromosome spreads were prepared from HeLa-S3 cells and immunostained with anti-p-CENP-AS7 and CREST antibodies. A × 9 magnification of a single chromosome is shown. The relative fluorescence intensity of p-CENP-AS7 relative to CREST was determined and mean values ± SEM are shown on the bottom left side of the panel (n = 30 cells for control and Aurora-A RNAi and 20 cells for Aurora-B RNAi, from a representative experiment; ****P < 0.0001; *P < 0.1; NS, not significant; non-parametric Kruskal–Wallis test). Bottom right panel: proportion of mitotic cells with PSCS (n = 4 experiments; > 200 cells per experiment were counted; ****P < 0.0001; ***P < 0.001; NS, not significant; one-way ANOVA) are shown. b HeLa cells were treated with MLN8054 (Aurora A inhibitor). Aurora A inhibition was monitored by western blotting with an anti-p-Aurora-AT288 as a marker of the Aurora-A active form (top of the panel); chromosome spreads were then stained with CREST (red) and anti-p-CENP-AS7 (green) antibodies. A × 9 magnification of a single chromosome is shown. Scale bar = 5 µm. The fluorescence intensity of p-CENP-AS7 signals relative to CREST signals mean values ± SEM are shown on the bottom left side of the panel (n = 25 cells for a representative experiment; ****P < 0.0001; non-parametric Kruskal–Wallis test). The mean ± SD of the percentage of cells displaying PSCS is shown on the bottom right of the panel (n = 3 experiments; > 200 cells per experiment were counted; ***P < 0.001; two-tailed unpaired parametric t test). c Following endogenous CENP-A siRNA depletion, CENP-A-HA-WT, CENP-A-HA-S7A, or CENP-A-HA-S7D cell lines were treated for 1 h with 10 µM MLN8054 Aurora-A-specific inhibitor and then cytospun to determine the proportion of mitotic cell displaying PSCS. The data shown are the mean ± SD (n = 3 experiments; at least 200 cells were counted per condition; **P < 0.01, ***P < 0.001, two-way ANOVA)
Fig. 4
Fig. 4
Aurora A localizes to the centromeres during mitosis. a Immunofluorescence microscopy on chromosome spreads, showing staining for Aurora A (green) and CREST (red) in HeLa cells transfected with control or Aurora-A siRNA. Images were overexposed to reveal weak signals. Magnifications (× 4.5) of chromosomes, and mean ± SEM quantifications of centromeric fluorescence signals for Aurora A are shown (n = 20 cells from a representative experiment; ****P < 0.0001; two-tailed unpaired nonparametric Mann–Whitney U-test). b Immunofluorescence microscopy on chromosome spreads, showing staining for Aurora-A-GFP and CREST in U2OS cells stably expressing a GFP-tagged-Aurora-A. Magnifications of single chromosomes are shown. Scale bar = 5 µm
Fig. 5
Fig. 5
CENP-AS7 phosphorylation is involved in sister chromatid cohesion and Sgo1 maintenance at centromeres in response to tension. a Chromosome spreads from CENP-A-HA-WT, CENP-A-HA-S7A, and CENP-A-HA-S7D cells depleted of endogenous CENP-A were immunostained for Sgo1 and HA. Magnifications (× 9) are shown. In the CENP-A-HA-S7A cell line, the presence and absence of Sgo1 immunostaining at the centromere of joined (empty arrow) or separated sister chromatids (full arrow and asterisk), respectively, are shown. Scale bar = 5 µm. b CENP-A-HA-WT and CENP-A-HA-S7A cell lines were treated or not with nocodazole for 3 hours. The means ± SD of PSCS percentages are shown on the left (n = 2 experiments; > 150 cells per experiment were counted; ****P < 0.0001; ***P < 0.001; NS, not significant; two-way ANOVA). Quantifications of Sgo1 in cell lines presenting joined or separated sister chromatids (SC) are shown on the right. The graph shows the means ± SEM from a representative experiment (n = at least 22 cells; ****P < 0.0001; ***P < 0.001; **P < 0.01; NS, not significant; non-parametric Kruskal–Wallis test). c CENP-A-HA-WT, CENP-A-HA-S7A and CENP-A-HA-S7D cell lines depleted from endogenous CENP-A were treated with 20 µM MG132 for 6 h and PSCS were scored. Means ± SD for the proportion of cells displaying PSCS are shown (n = 4 experiments; > 150 cells per experiment were counted; ****P < 0.0001; ***P < 0.001; **P < 0.01; two-way ANOVA). d Means ± SEM from a representative experiment quantifying Sgo1 fluorescence intensity on joined or separated SC after the depletion of endogenous CENP-A in CENP-A-HA-WT, CENP-A-HA-S7A, and CENP-A-HA-S7D cell lines further treated with 20 µM MG132 for 6 h (n = 23–26 cells, except for S7D with separated SC where n = 14; ****P < 0.0001; ***P < 0.001; **P < 0.01; *P < 0.1; NS, not significant; non-parametric Kruskal–Wallis test). e CENP-A-HA-WT and CENP-A-HA-S7A cell lines depleted from endogenous CENP-A and synchronized as indicated were scored for PSCS after 3 or 6 h following nocodazole or MG132 treatment. The means ± SD of PSCS percentages are shown on the left (n = 2 experiments; > 200 cells per experiment). Right panel: mitotic indexes (n = 2 experiments, > 400 cells per experiment)
Fig. 6
Fig. 6
Bub1 regulates CENP-AS7 phosphorylation and Aurora-A targeting at centromeres. ab HeLa cells depleted of Bub1 by siRNA were immunostained with anti-p-CENP-AS7 (a) or anti-Aurora-A (b) and CREST antibodies. Magnifications (× 9) of single chromosomes are shown. Means ± SEM are shown (on the right of the panel) for the quantification of signal intensity relative to CREST obtained with antibodies against p-CENP-AS7 or Aurora A antibodies in a representative experiment (for p-CENP-AS7 intensity, n = 20 cells in each condition; for Aurora A intensity, n = 25 cells in control and 20 cells in Bub1 RNAi conditions; ****P < 0.0001; two-tailed unpaired nonparametric Mann–Whitney U-test). c Metaphase chromosome spreads from CENP-A-HA-WT, CENP-A-HA-S7A, and CENP-A-HA-S7D cell lines depleted of Bub1 were immunostained with antibodies against Bub1 and Sgo1. Scale bar = 5 µm. Inter-kinetochore distance means ± SEM of five to six representative cells with joined SC are shown (n = 10–50 chromosomes for each cell). Statistical analysis were performed on the mean of the distance measured for each cell (n = 5–6; ****P < 0.0001; ***P < 0.001; NS, not significant; two-way ANOVA with Tukey’s post hoc analysis)

References

    1. McKinley KL, Cheeseman IM. The molecular basis for centromere identity and function. Nat. Rev. Mol. Cell Biol. 2016;17:16–29. doi: 10.1038/nrm.2015.5. - DOI - PMC - PubMed
    1. Blower MD, Sullivan BA, Karpen GH. Conserved organization of centromeric chromatin in flies and humans. Dev. Cell. 2002;2:319–330. doi: 10.1016/S1534-5807(02)00135-1. - DOI - PMC - PubMed
    1. Dunleavy EM, Almouzni G, Karpen GH. H3.3 is deposited at centromeres in S phase as a placeholder for newly assembled CENP-A in G(1) phase. Nucleus. 2011;2:146–157. doi: 10.4161/nucl.2.2.15211. - DOI - PMC - PubMed
    1. Sullivan BA, Karpen GH. Centromeric chromatin exhibits a histone modification pattern that is distinct from both euchromatin and heterochromatin. Nat. Struct. Mol. Biol. 2004;11:1076–1083. doi: 10.1038/nsmb845. - DOI - PMC - PubMed
    1. Marshall OJ, Marshall AT, Choo KH. Three-dimensional localization of CENP-A suggests a complex higher order structure of centromeric chromatin. J. Cell Biol. 2008;183:1193–1202. doi: 10.1083/jcb.200804078. - DOI - PMC - PubMed

Publication types

MeSH terms

LinkOut - more resources