. 2018 May 14;9(1):1869.
doi: 10.1038/s41467-018-04350-1.

Silicon-chip-based mid-infrared dual-comb spectroscopy

Affiliations

Silicon-chip-based mid-infrared dual-comb spectroscopy

Mengjie Yu et al. Nat Commun. .

Abstract

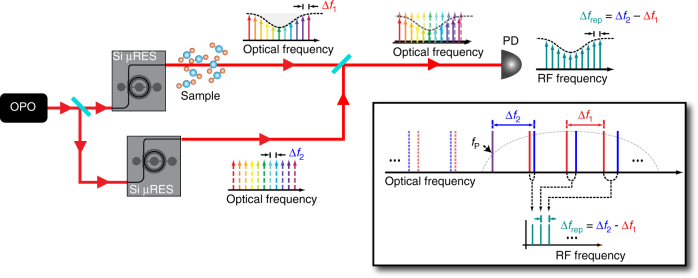
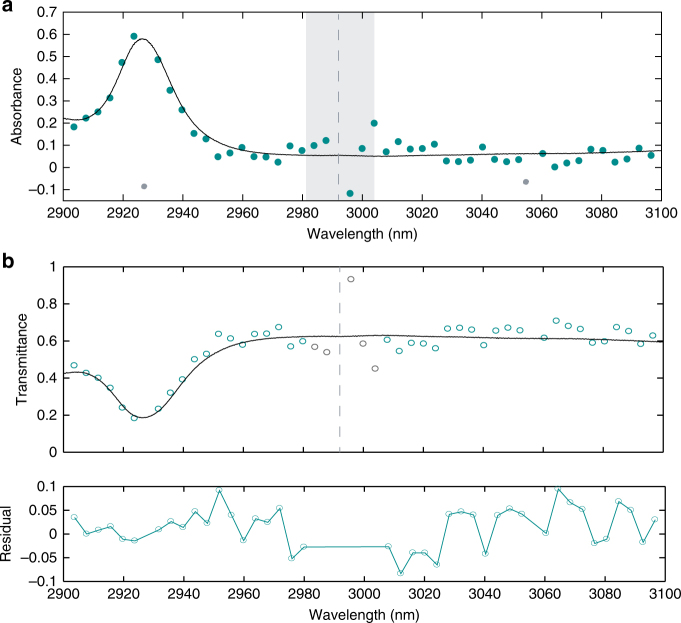
The development of a spectroscopy device on a chip that could realize real-time fingerprinting with label-free and high-throughput detection of trace molecules represents one of the big challenges in sensing. Dual-comb spectroscopy (DCS) in the mid-infrared is a powerful technique offering high acquisition rates and signal-to-noise ratios through use of only a single detector with no moving parts. Here, we present a nanophotonic silicon-on-insulator platform designed for mid-infrared (mid-IR) DCS. A single continuous-wave low-power pump source generates two mutually coherent mode-locked frequency combs spanning from 2.6 to 4.1 μm in two silicon microresonators. A proof-of-principle experiment of vibrational absorption DCS in the liquid phase is achieved acquiring spectra of acetone spanning from 2900 to 3100 nm at 127-GHz (4.2-cm-1) resolution. These results represent a significant step towards a broadband, mid-IR spectroscopy instrument on a chip for liquid/condensed matter phase studies.


Conflict of interest statement

The authors declare no competing interests.

Figures

Fig. 1
Fig. 1
Schematic for dual-comb absorption spectroscopy. Experimental setup for our dual-comb source. A continuous-wave optical parametric oscillator pumps two separate silicon microresonators, which generate two modelocked combs. The output is combined and sent to a photodiode for RF characterization. Inset: Schematic for single-pump operation and mapping from optical to RF domain. ∆f1 and ∆f2 are the repetition frequencies of two optical frequency combs. ∆frep = ∆f2 − ∆f1 is the difference in repetition frequencies. PD, photodiode; Si μRES, silicon microresonator; OPO, optical parametric oscillator
Fig. 2
Fig. 2
Silicon microresonator-based dual-comb source. a A spectrum of one of the generated combs measured using a Michelson-based Fourier transform infrared spectrometer (M-FT). The spectral range is from 2.6 to 4.1 µm. The resolution is 7 GHz (0.25 cm−1). b RF-noise characterization of the generated comb. The plot shows the reduction in RF amplitude noise corresponding to modelocking
Fig. 3
Fig. 3
Characterization of dual-comb source. a Spectra for each modelocked comb (red, black). Combined M-FT spectrum (blue). b RF spectrum from the dual-comb interferometer. Plot shows RF spectra for dual-comb (blue), each separate modelocked comb (black and red), and detector noise background (dark cyan). Inset: Characterization of the 25th RF beatnote in b
Fig. 4
Fig. 4
Repetition rate tuning of the dual-comb source. The frequency spacing of the dual-comb source is dictated by the spacing of each of the modelocked combs. The plot shows 14 MHz spacing (a) and a 26 MHz spacing (b). The spacing is tuned by adjusting the thermoelectric coolers to change the resonance position of the microresonators
Fig. 5
Fig. 5
Experimental interferogram and spectrum. a Time-domain interferogram over a measurement time of 2 µs. The waveform repeats with a period of 25.6 ns, which is the inverse of the difference in comb line spacing (39 MHz). The waveform of one period is shaded and demonstrates good reproducibility. The multiple bursts within one period indicate that multiple solitons are generated in each microresonator within one cavity roundtrip. b Fourier-transformed spectrum of the time-domain interferogram in a, on a logarithmic scale with 24 resolved lines and an average signal-to-noise ratio of 13.8 dB (≈24). Modulation in the spectrum is also due to both comb operating in multiple soliton regime. The missing RF beat note at 0.64 GHz is due to the absence of a comb line, which is attributed to a mode crossing effect within the microresonator
Fig. 6
Fig. 6
Absorption spectroscopy over a short measurement time. Two different bandpass filters are used to access the two sides of the dual-comb spectrum that are symmetric with respect to the pump wavelength of 2992 nm. The measurement time is 2 µs for each side of the dual-comb spectrum. The transmittance is calculated as the ratio between the spectrum with the cuvette and the spectrum without the cuvette. a The absorbance is the logarithm of the transmittance. The results are compared to the absorption measurement using a Michelson-based Fourier transform spectrometer equipped with a globar. The shaded region near the pump frequency (dashed line) shows large variations, which we attribute to the low SNR of the corresponding RF beat notes (<10 dB) and the imperfect spectral response of the two bandpass filters. Two points (gray) at 2927 and 3055 nm are due to missing RF beat notes shown in Fig. 5b and therefore not plotted in the transmittance curve (b). b Transmittance and its residual. The five points in gray are not used for the residual. The standard deviation of the residual is 4.1%, which is largely limited by the averaged SNR of 24 in the dual-comb spectrum

References

    1. Coddington I, Newbury N, Swann W. Dual-comb spectroscopy. Optica. 2016;3:414–426. doi: 10.1364/OPTICA.3.000414. - DOI - PMC - PubMed
    1. Bernhardt B, et al. Mid-infrared dual-comb spectroscopy with 2.4 μm Cr2+:ZnSe femtosecond lasers. Appl. Phys. B. 2010;100:3–8. doi: 10.1007/s00340-010-4080-0. - DOI
    1. Bernhardt B, et al. Cavity-enhanced dual-comb spectroscopy. Nat. Photon. 2010;4:55–57. doi: 10.1038/nphoton.2009.217. - DOI
    1. Baumann E, et al. Spectroscopy of the methane ν3 band with an accurate midinfrared coherent dual-comb spectrometer. Phys. Rev. A. 2011;84:062513. doi: 10.1103/PhysRevA.84.062513. - DOI
    1. Ideguchi T, Bernhardt B, Guelachvili G, Hänsch TW, Picqué N. Raman-induced Kerr-effect dual-comb spectroscopy. Opt. Lett. 2012;37:4498–4500. doi: 10.1364/OL.37.004498. - DOI - PubMed

Publication types