. 2018 May 14;9(1):1880.
doi: 10.1038/s41467-018-04285-7.

Minerals in the pre-settled coral Stylophora pistillata crystallize via protein and ion changes

Affiliations

Minerals in the pre-settled coral Stylophora pistillata crystallize via protein and ion changes

Anat Akiva et al. Nat Commun. .

Abstract

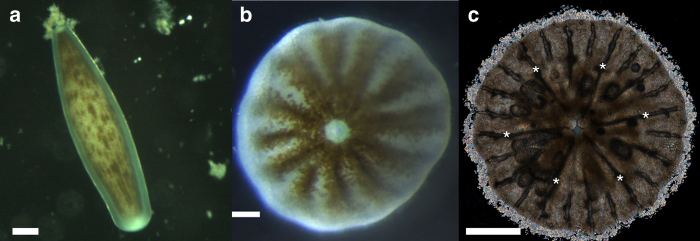
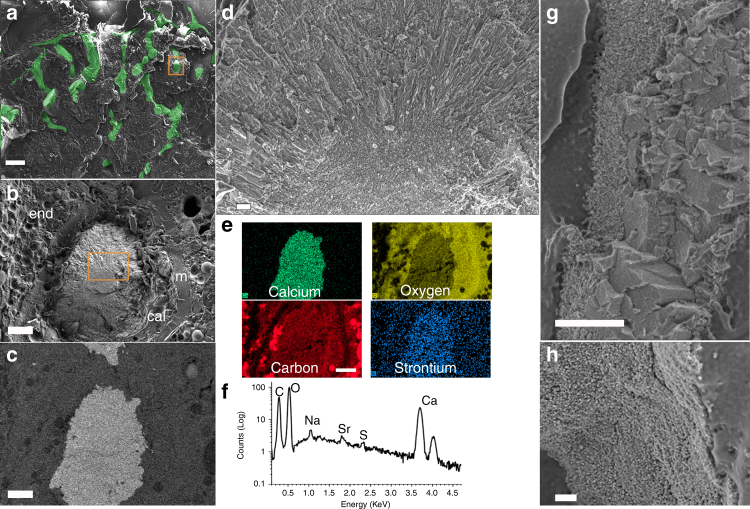
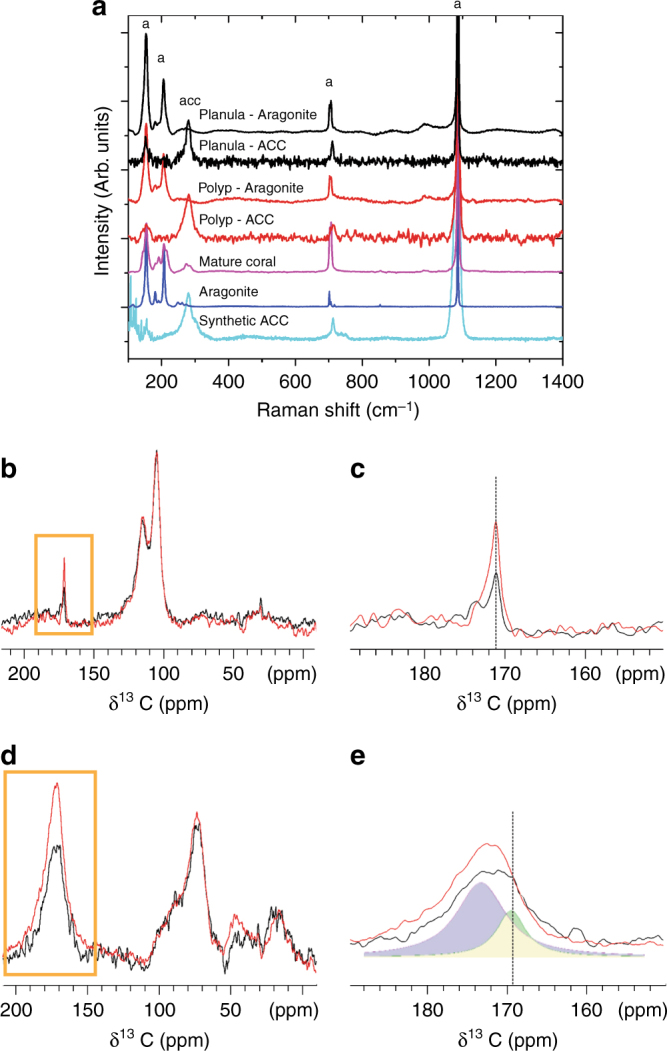
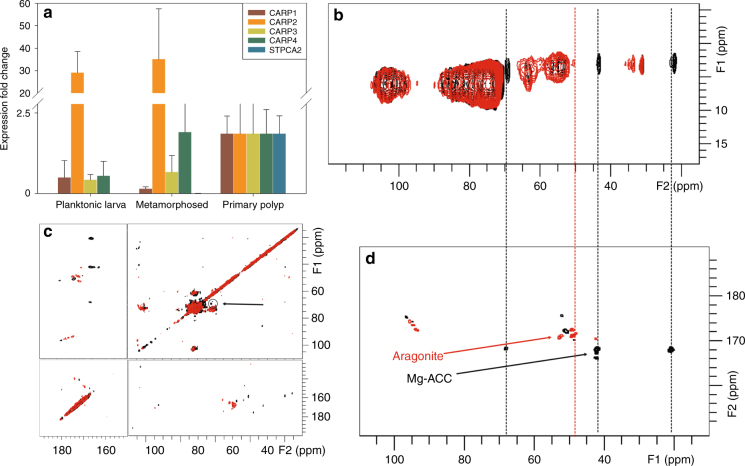
Aragonite skeletons in corals are key contributors to the storage of atmospheric CO2 worldwide. Hence, understanding coral biomineralization/calcification processes is crucial for evaluating and predicting the effect of environmental factors on this process. While coral biomineralization studies have focused on adult corals, the exact stage at which corals initiate mineralization remains enigmatic. Here, we show that minerals are first precipitated as amorphous calcium carbonate and small aragonite crystallites, in the pre-settled larva, which then evolve into the more mature aragonitic fibers characteristic of the stony coral skeleton. The process is accompanied by modulation of proteins and ions within these minerals. These findings may indicate an underlying bimodal regulation tactic adopted by the animal, with important ramification to its resilience or vulnerability toward a changing environment.


Conflict of interest statement

The authors declare no competing interests.

Figures

Fig. 1
Fig. 1
Light microscopy images of Stylophora pistillata larvae. a The pre-settled, elongated, planktonic larva (side view). b A globe-shape mature planula at the pre-settled metamorphosed stage. The brown features are attributed to endosymbiont algae. c The primary settled polyp (bottom view). Under polarized light, the birefringent crystals formed on the circumference appear as bright spots, while the mineralized septa, covered by organic layers of tissue, appear as the long dark streaks (the six primary septa are marked by asterisks), scale bars: a, c 500 µm; b 200 µm
Fig. 2
Fig. 2
Cryo-SEM images of mineral deposits at metamorphosed planula. a Top view secondary electron (SE) image of a pre-settled metamorphosed planula. bd Early stage of mineral deposition. b SE image of a mineral deposit randomly found within the organic material of the endoderm and lipidic region. The mineral deposit is ~10-µm long. It is digitally colored in green based on the backscattered electron (BSE) image in c. c BSE image of the same region as in b. d Higher magnification of the region depicted by an orange box in c, showing the mineral deposit morphology and the interface with the organic material of the tissue. The mineral is composed of nanogranular particles as can be seen in the insert in d. e Cryo-EDS maps of the mineral deposit in b, showing the distribution of calcium, oxygen, carbon, and magnesium in the mineral deposit and in the surrounding organic matter. f Cryo-EDS spectrum of the mineral in b. The spectrum is presented on a logarithmic scale. gi A developing aragonite mineral embedded in the organic material of the tissue. g SEM image of a 10 µm aragonite crystal, colored in green based on the BSE image. h SE image of the region depicted in an orange box in g, showing the mineral. i Higher magnification of the region depicted in an orange box in h, showing that acicular aragonite crystals emerge from a nanogranular structure (end, endoderm; m, mesoglea; ect, ectoderm; lip, lipid gland). Scale bars: a 20 µm; b, c, g 10 µm; h, e 2 µm; i 400 nm; d insert, 200 nm
Fig. 3
Fig. 3
Cryo-SEM images of minerals at the primary polyp. a Low-magnification SE image of a primary polyp showing the part of the primary mineralized septa radially arrayed in hexacoral pattern (digitally colored in green). b High-resolution SE image of the mineral delimited by the orange box in a showing the mineral deposit surrounded by the calicoblastic layer (cal), mesoglea (m), and endoderm (end). c The corresponding BSE image of b. d High-resolution SE image of the mineral delimited by the orange box in b, showing the center of calcification with nanogranular structure from which long acicular aragonite rods extend. e Cryo-EDS maps of the mineral deposit in b, showing the distribution of calcium, oxygen, carbon, and strontium in the mineral deposit and in the organic material of the tissue. f Cryo-EDS spectrum of the mineral in b, presented on a logarithmic scale. g Exemplary SE image of a septum comprising two mineral morphologies, a region of nanogranular mineral, and a region of aragonite fibers. h Higher magnification of the nanogranular mineral of the septum. Scale bars: a 100 µm; b, c, e 10 µm; d 200 nm; g, h 1 µm
Fig. 4
Fig. 4
Spectroscopic mineral determination in the two stages. a Raman spectra of synthetic ACC (cyan), geological aragonite (blue), mature coral (pink), settled primary polyp (red), and pre-settled metamorphosed planula (black), showing the presence of the major aragonite bands and ACC. The main differences are in the low-wavenumber region (100–300 cm−1) showing a clear signature of ACC in both early stages. be 13C ssNMR spectra of the entire pre-settled metamorphosed planulae (black) and primary polyps (red). b 13C direct excitation spectra of the two developmental stages. c The carbonate/carbonyl region of the spectra in b, showing the marked increase in the content of the bulk mineral after settlement. d 13C cross-polarization spectra of planulae and polyps enhancing the carbons with vicinal protons. e Magnification of the carbonate/carbonyl region of the spectra in d, showing changes of the disordered CaCO3 line upon settling due to maturation of the carbonate ions. Dashed lines mark the location of the carbonate peaks in c and e. Peak analysis can be found in supporting information (Supplementary Figures 6 and 7). In the Raman spectra, typical peaks of aragonite (a) and ACC (acc) are indicated
Fig. 5
Fig. 5
Identification of functional protein in the two stages. a qPCR analysis of the relative expression levels of distinct skeletal organic matrix genes determined by the ΔΔCT method (see Methods section). The expression fold change is relative to the expression in the settled primary polyp stage. All samples were collected in triplicate and the results are presented as the average fold change ± SE, n = 3. b 2D 1H–13C HETCOR spectra of pre-settled metamorphosed planula (black) and primary polyp (red). Spectra were recorded using a contact time of 2 ms, recycle delay of 1 s, and 4000 scans. c 2D 13C DARR NMR spectra of the entire pre-settled metamorphosed planulae (black) and entire primary polyps (red). The 2D DARR spectra show a large diagonal ridge and several off-diagonal peaks, appearing as dots in the 2D maps. These peaks indicate magnetization transfers between two different carbons. The peak at (F2, F1):(62, 68) encircled and marked by the arrow, indicates the magnetization transfer between threonine Cβ–Cα carbons. It is unique and characteristic of a protein with Thr prevalent in its sequence. d 2D 13C DARR (carbonate region)–blow-up of the carbonate region (upper left fraction in Fig. 5c rotated 90° counterclockwise) showing the strong correlations of the organic carbons with the disordered mineral phase at 169.5 ppm in the pre-settled planula metamorphosed and the weak correlations with the disordered aragonite at 171 ppm in the primary polyp. Dashed lines correlate common carbons peaks in the HETCOR (b) and in the DARR spectra (d)

Comment in

References

    1. Von Euw S, et al. Biological control of aragonite formation in stony corals. Science. 2017;356:933–938. doi: 10.1126/science.aam6371. - DOI - PubMed
    1. Mass T, et al. Amorphous calcium carbonate particles form coral skeletons. Proc. Natl Acad. Sci. USA. 2017;114:E7670–E7678. doi: 10.1073/pnas.1707890114. - DOI - PMC - PubMed
    1. Albright R, Mason B, Miller M, Langdon C. Ocean acidification compromises recruitment success of the threatened Caribbean coral Acropora palmata. Proc. Natl Acad. Sci. USA. 2010;107:20400–20404. doi: 10.1073/pnas.1007273107. - DOI - PMC - PubMed
    1. Wu, H. C. et al. Primary life stage boron isotope and trace elements incorporation in aposymbiotic Acropora millepora coral under ocean acidification and warming. Front. Mar. Sci.4 10.3389/fmars.2017.00129 (2017).
    1. de Putron SJ, McCorkle DC, Cohen AL, Dillon AB. The impact of seawater saturation state and bicarbonate ion concentration on calcification by new recruits of two Atlantic corals. Coral Reefs. 2011;30:321–328. doi: 10.1007/s00338-010-0697-z. - DOI

Publication types

LinkOut - more resources