. 2018 May 14;9(1):1875.
doi: 10.1038/s41467-018-04250-4.

CO2-sensitive tRNA modification associated with human mitochondrial disease

Affiliations

CO2-sensitive tRNA modification associated with human mitochondrial disease

Huan Lin et al. Nat Commun. .

Abstract

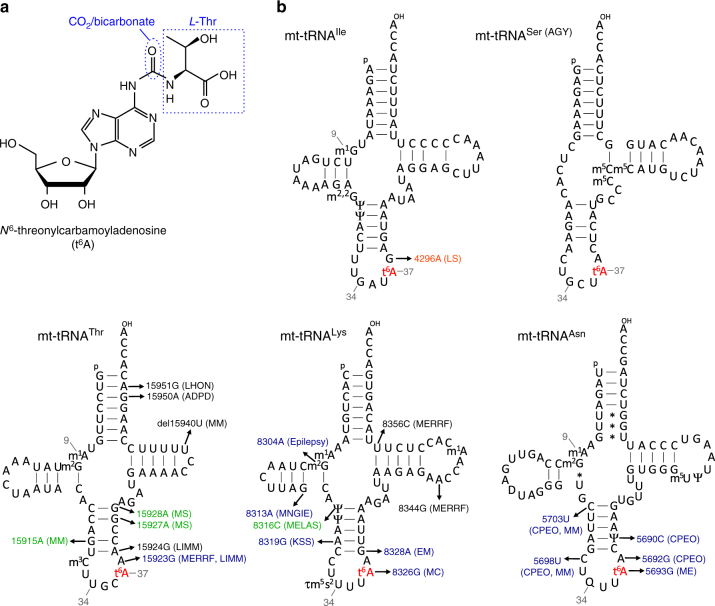
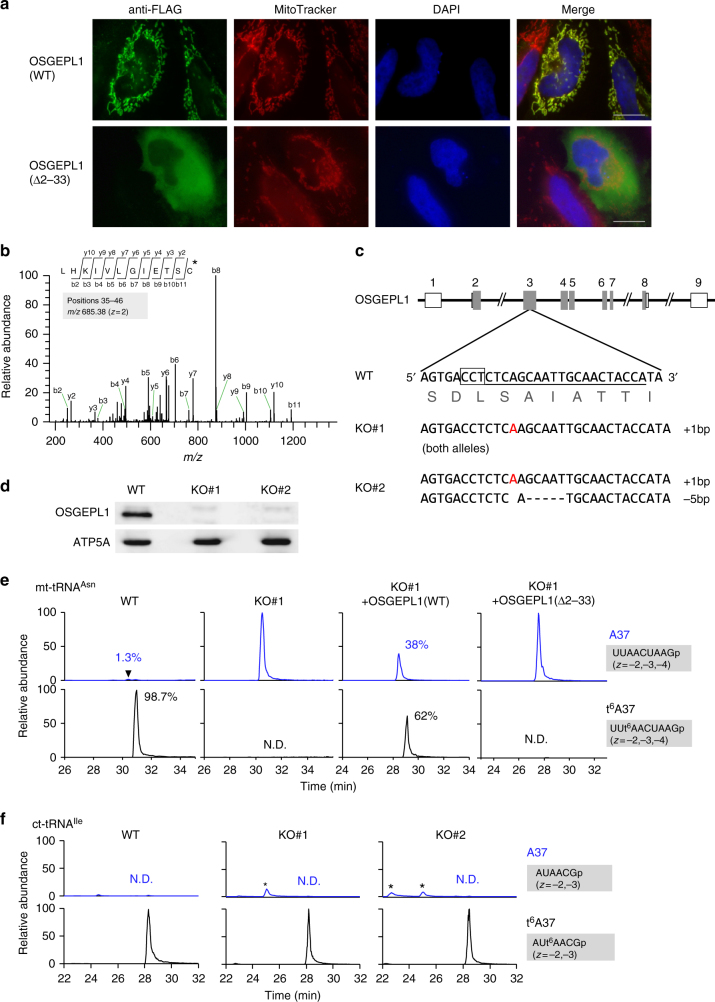
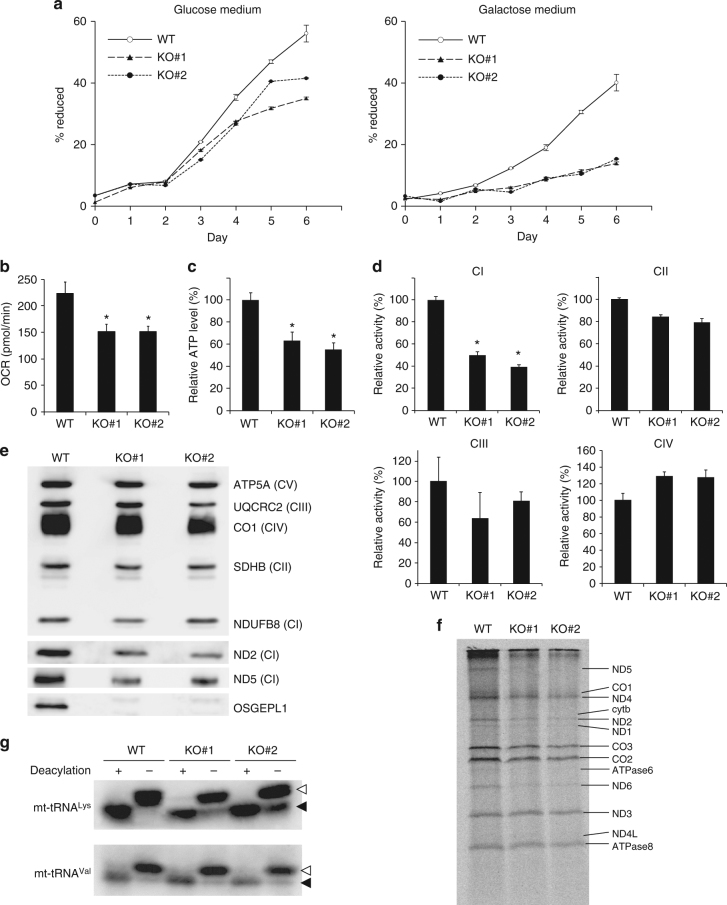
It has been generally thought that tRNA modifications are stable and static, and their frequencies are rarely regulated. N6-threonylcarbamoyladenosine (t6A) occurs at position 37 of five mitochondrial (mt-)tRNA species. We show that YRDC and OSGEPL1 are responsible for t6A37 formation, utilizing L-threonine, ATP, and CO2/bicarbonate as substrates. OSGEPL1-knockout cells exhibit respiratory defects and reduced mitochondrial translation. We find low level of t6A37 in mutant mt-tRNA isolated from the MERRF-like patient's cells, indicating that lack of t6A37 results in pathological consequences. Kinetic measurements of t6A37 formation reveal that the Km value of CO2/bicarbonate is extremely high (31 mM), suggesting that CO2/bicarbonate is a rate-limiting factor for t6A37 formation. Consistent with this, we observe a low frequency of t6A37 in mt-tRNAs isolated from human cells cultured without bicarbonate. These findings indicate that t6A37 is regulated by sensing intracellular CO2/bicarbonate concentration, implying that mitochondrial translation is modulated in a codon-specific manner under physiological conditions.


Conflict of interest statement

The authors declare no competing interests.

Figures

Fig. 1
Fig. 1
N6-threonylcarbamoyladenosine (t6A) in human mt-tRNAs. a Chemical structure of t6A. Carbonyl group derived from CO2/bicarbonate and Thr moiety are indicated. b Secondary structure and post-transcriptional modifications of five human mt-tRNAs bearing t6A37. Pathogenic point mutations deposited in MITOMAP are indicated in each tRNA. The color codes for the mutations are consistent with those in Fig. 5c, d. Abbreviations: 1-methylguanosine, m1G; N2,N2-dimethylguanosine, m2,2G; pseudouridine, Ψ; N6-threonylcarbamoyladenosine, t6A; 5-methylcytidine, m5C; 1-methyladenosine, m1A; N2-methylguanosine, m2G; 3-methylcytidine, m3C; 5-taurinomethyl-2-thiouridine, τm5s2U; queuosine, Q; 5-methyluridine, m5U; LHON Leber hereditary optic neuropathy; ADPD Alzheimer’s disease and Parkinson’s disease; MM mitochondrial myopathy; MS multiple sclerosis; LIMM lethal infantile mitochondrial myopathy; MERRF myoclonus epilepsy associated with ragged red fibers; EM encephalomyopathy; KSS Kearns Sayre syndrome; MELAS mitochondrial myopathy, encephalopathy, lactic acidosis, and stroke-like episodes; MNGIE mitochondrial neurogastro intestinal encephalomyopathy; CPEO chronic progressive external ophthalmoplegia; MC mitochondrial cytopathy; LS Leigh syndrome
Fig. 2
Fig. 2
YRDC is responsible for t6A37 formation in mt-tRNAs. a Subcellular localization of wild-type (WT) and mutant YRDC (S17F, A15F/S17F) in HeLa cells immunostained with an anti-FLAG antibody (Green). Nuclei and mitochondria were stained with DAPI (blue) and MitoTracker (Red), respectively. All images were superimposed to generate the merged panel. Scale bars: 20 μm. b Mitochondrial localization of YRDC. Whole-cell lysates (W.L.) and mitochondrial fractions (Mito.) from HEK293T cells transfected with WT, variant with N-terminal truncation (a.a. Δ2–15), and mutant (A15F/S17F) YRDC constructs were subjected to western blotting with anti-FLAG antibody to detect YRDC variants, anti-CO1 (mitochondrial marker), and anti-GAPDH (cytoplasmic marker). Uncut gel images are provided in Supplementary Fig. 15. c Determination of the cleavage site in the MTS of YRDC. Schematic depiction of YRDC with a predicted MTS (blue) and a conserved region homologous to that of E. coli YrdC (green). Multiple cleavage sites in the long and the short isoforms of YRDC expressed in HeLa cells are indicated by white and black arrowheads, respectively. The CID spectrum represents the sequence of the N-terminal tryptic peptide of the short isoform with the cleavage site at position 52. The precursor ion for CID is m/z 565.28. Product ions are assigned on the peptide sequence. d Top: schematic of human YRDC gene and the site of insertion introduced with the CRISPR–Cas9 system. Shaded boxes indicate coding regions; open boxes indicate untranslated regions of exons; lines indicate introns. Inset: exon 1 of WT YRDC. The target sequence of the single guide RNA (sgRNA) is underlined; the protospacer adjacent motif (PAM) sequence is outlined. Bottom: sequence of the frameshift cell line (FS#1); the inserted C is indicated in red. e Extracted ion chromatograms (XICs) generated by integration of multiply-charged negative ions of the A37-containing fragments of human mt-tRNAIle with A37 (top) or t6A37 (bottom) (Supplementary Table 1) isolated from WT (left) and FS#1 (right) cell lines. t6A frequencies (%) are described as mean values ± s.d. of technical triplicate. f XICs generated by integration of multiply-charged negative ions of A37-containing fragments of human ct-tRNAIle(IAU) with A37 (top) or t6A37 (bottom) (Supplementary Table 1) isolated from WT (left) and FS#1 (right) cell lines
Fig. 3
Fig. 3
OSGEPL1 is responsible for t6A37 formation in mt-tRNAs. a Subcellular localization of wild-type (WT) and N-terminal truncated (a.a. Δ2–33) OSGEPL1 in HeLa cells immunostained with an anti-FLAG antibody (Green). Nuclei and mitochondria were stained with DAPI (blue) and MitoTracker (Red), respectively. All images were superimposed to generate the merged panel. Scale bars: 20 μm. b Determination of the cleavage site in the MTS in OSGEPL1. The CID spectrum represents a sequence of N-terminal peptide of OSGEPL1 starting from position 35. The precursor ion for CID is m/z 685.38. Product ions are assigned on the peptide sequence. C* stands for alkylated cysteine residue. c Top: schematic of human OSGEPL1 gene and sites of mutations introduced by the CRISPR–Cas9 system. Shaded boxes indicate coding regions; open boxes indicate untranslated regions of exons; lines indicate introns. Inset: exon 3 of WT OSGEPL1. The target sequence of the single guide RNA (sgRNA) is underlined; the protospacer adjacent motif (PAM) sequence is outlined. Bottom: sequences of KO#1 and KO#2 cell lines. The inserted sequence is indicated in red and deleted sequences are indicated by dashed lines. d Confirmation of KO lines by western blotting of endogenous OSGEPL1 and the mitochondrial marker ATP5A (as a control). Uncut gel images are provided in Supplementary Fig. 15. e XICs generated by integration of multiply-charged negative ions of the A37-containing fragments of human mt-tRNAAsn bearing A37 (top) or t6A37 (bottom) (Supplementary Table 1) isolated from WT, KO#1, and KO#1 rescued by plasmid-encoded OSGEPL1 (WT and a.a. Δ2–33). N.D., not detected. Intensity fractions (%) of modified or unmodified fragments are indicated. f XICs generated by integration of multiply-charged negative ions of the A37-containing fragments of human ct-tRNAIle(IAU) bearing A37 (top) and t6A37 (bottom) (Supplementary Table 1) isolated from WT, KO#1, and KO#2
Fig. 4
Fig. 4
Mitochondrial dysfunction in OSGEPL1 KO cells. a Growth curves for WT HEK293T, OSGEPL1 KO#1, and OSGEPL1 KO#2 cells cultured in the presence of glucose (left) or galactose (right) as the primary carbon source. Mean values ± s.e.m. of four independent cultures are plotted. b Oxygen consumption rates of WT, OSGEPL1 KO#1, and OSGEPL1 KO#2 cells measured using an XFp extracellular flux analyzer. Mean values ± s.d. of biological triplicates are compared. *P < 0.05, Student’s t-test. c Steady-state levels of ATP in WT, OSGEPL1 KO#1, and OSGEPL1 KO#2 cells. Mean values ± s.e.m. of three independent experiments are compared. *P < 0.05, Student’s t-test. d Relative activities of respiratory complexes I, II, III, and IV (CI–IV) in WT, OSGEPL1 KO#1, and KO#2 cells. Mean values ± s.e.m. of three independent experiments are compared. *P < 0.05, Student’s t-test. e Steady-state levels of subunit proteins in respiratory chain complexes. Mitochondrial fractions of WT, OSGEPL1 KO#1, and KO#2 cells resolved by SDS-PAGE were analyzed by western blotting with the indicated antibodies. A gel stained with Coomassie brilliant blue (CBB) is shown in Supplementary Fig. 6a. Uncut gel images are provided in Supplementary Fig. 15. f Pulse labeling of mitochondrial protein synthesis. WT, OSGEPL1 KO#1, and KO#2 cells were labeled with [35S] methionine and [35S] cysteine after cytoplasmic protein synthesis was halted with emetine. Whole-cell lysates were resolved by Tricine-SDS-PAGE and stained with CBB as a loading control (Supplementary Fig. 6b). The dried gel was exposed to an imaging plate and visualized on a fluorimager. Assignment of mitochondrial proteins is indicated. Uncut gel images are provided in Supplementary Fig. 15. g In vivo aminoacylation levels of mt-tRNALys and mt-tRNAVal in WT, OSGEPL1 KO#1, and OSGEPL1 KO#2 cells. Crude aminoacyl-tRNAs extracted under acidic conditions were treated with (+) or without (−) mild alkali for deacylation and subjected to acid urea-PAGE and northern blotting. White and black arrowheads indicate aminoacyl-tRNA and deacyl-tRNA, respectively. Aminoacylation level of each condition was calculated from the band intensities. Lysylation levels of mt-tRNAsLys from WT, KO#1, and KO#2 are 98.4%, 89.9%, and 83.9%, respectively. Valylation levels of mt-tRNAsVal from WT, KO#1, and KO#2 are 90.1%, 90.3%, and 89.1%, respectively. Uncut gel images are provided in Supplementary Fig. 15
Fig. 5
Fig. 5
In vitro reconstitution of t6A37 on mt-tRNAs and impairment of t6A37 by pathogenic point mutations associated with mitochondrial diseases. a In vitro formation of t6A37 on mt-tRNAThr transcripts with or without YRDC and OSGEPL1 in the presence of Thr, ATP, and bicarbonate. After the reaction, mt-tRNAThr was digested with RNase T1 and analyzed by LC/MS. XICs generated by integration of multiply-charged negative ions of A37-containing fragments of mt-tRNAThr harboring A37 (top) and t6A37 (bottom) (Supplementary Table 1). Intensity fractions (%) of modified or unmodified fragments are denoted. N.D., not detected. b In vitro formation of t6A37 on mt-tRNAIle transcript or native mt tRNAIle isolated from OSGEPL1 KO#1 cells. XICs generated by integration of multiply-charged negative ions of A37-containing fragments of mt-tRNAIle harboring A37 (top) and t6A37 (bottom) (Supplementary Table 1). Intensity fractions (%) of modified or unmodified fragments are denoted. c Efficiency of t6A37 formation in mt-tRNA mutants. The numbering of each mutant corresponds to that in Fig. 1b. Bars corresponding to severe and mild reduction in t6A37 formation are colored in blue and green, respectively. d G4296A in mt-tRNAIle (left panel) is a unique pathogenic mutation that promotes t6A37 formation. XICs show A37-containing fragments of WT and G4296A mutant mt-tRNAIle harboring A37 (black) and t6A37 (red). m/z values of each fragment are listed in Supplementary Table 1. e Impairment of t6A37 in mt-tRNAThr with A15923G mutation isolated from the myoblasts of a patient with MERRF-like symptoms. Anticodon stem-loop sequences of WT (left) and A15923G mutant (right) mt-tRNAThr. Positions of RNase T1 and RNase A digestion are indicated by arrowheads. m3C32 in the A15923G mutant is partially converted to C32 (Supplementary Fig. 5b). XICs generated by integration of multiply-charged negative ions of A37-containing fragments of mt-tRNAThr harboring A37 (upper panels) and t6A37 (lower panels) (Supplementary Table 1) from WT (left panels) and A15923G myoblasts (right panels). Intensity fractions (%) of modified or unmodified fragments are indicated
Fig. 6
Fig. 6
Mitochondrial t6A37 formation is sensitive to intracellular bicarbonate concentration. a Kinetic analyses of mitochondrial t6A37 formation mediated by YRDC and OSGEPL1. Initial velocities of t6A37 formation were measured against variable concentrations of mt-tRNAThr, L-Thr, ATP, and bicarbonate. Km values for each substrate are indicated. b Hypomodification of t6A37 in mt-tRNAs in HEK293T cells cultured in non-bicarbonate medium. XICs generated by integration of multiply-charged negative ions of A37-containing fragments of mt-tRNASer(AGY) (top panels), mt-tRNAAsn (second panels), mt-tRNAThr (third panels), mt-tRNALys with s2U34 (fourth panels) and ct-tRNAIle (bottom panels) bearing A37 (blue) and t6A37 (black) (Supplementary Table 1) isolated from HEK293T cells cultured with normal DMEM medium (44 mM NaHCO3) in 5% CO2 (left panels) and non-bicarbonate medium in air (right panels). mt-tRNASer(AGY) and other tRNAs were isolated from the cells cultured for 6 and 3 days, respectively. t6A frequencies (%) are described as mean values ± s.d. of technical triplicate
Fig. 7
Fig. 7
Metabolism of bicarbonate and t6A37 formation in cytoplasm and mitochondria. CO2 produced by TCA cycle is hydrated to form bicarbonate by carbonic anhydrase 5 (CA5) in mitochondria. In addition, mitochondrial CO2 is exported to cytoplasm and hydrated by carbonic anhydrase 2 (CA2). In hypoxic conditions, carbonic anhydrase 9 (CA9) is overexpressed on the cell surface by HIF-1 pathway. CA9 generates large amounts of bicarbonate outside the cell. Then, cells actively import extracellular bicarbonate to neutralize lactate and prevent acidification. YRDC employs bicarbonate to synthesize TC-AMP, which is used for t6A37 formation on tRNAs mediated by KEOPS complex in cytoplasm and by OSGEPL1 in mitochondria. Hypomodification of t6A37 in two mt-tRNAs in the cells cultured without bicarbonate, as well as from hypoxic solid tumors, indicating codon-specific translational regulation by sensing intracellular bicarbonate

References

    1. Chen K, Zhao BS, He C. Nucleic acid modifications in regulation of gene expression. Cell Chem. Biol. 2016;23:74–85. doi: 10.1016/j.chembiol.2015.11.007. - DOI - PMC - PubMed
    1. Frye M, Jaffrey SR, Pan T, Rechavi G, Suzuki T. RNA modifications: what have we learned and where are we headed? Nat. Rev. Genet. 2016;17:365–372. doi: 10.1038/nrg.2016.47. - DOI - PubMed
    1. Machnicka MA, et al. MODOMICS: a database of RNA modification pathways--2013 update. Nucleic Acids Res. 2013;41:D262–D267. doi: 10.1093/nar/gks1007. - DOI - PMC - PubMed
    1. El Yacoubi B, Bailly M, de Crécy-Lagard V. Biosynthesis and function of posttranscriptional modifications of transfer RNAs. Annu. Rev. Genet. 2012;46:69–95. doi: 10.1146/annurev-genet-110711-155641. - DOI - PubMed
    1. Suzuki, T. in Fine-Tuning of RNA Functions by Modification and Editing Vol. 12 (ed. Henri, G.) 23–69 (Springer-Verlag, Berlin-Heidelberg, 2005).

Publication types

MeSH terms