. 2018 May 14;9(1):1886.
doi: 10.1038/s41467-018-04309-2.

Top-down descending facilitation of spinal sensory excitatory transmission from the anterior cingulate cortex

Affiliations

Top-down descending facilitation of spinal sensory excitatory transmission from the anterior cingulate cortex

Tao Chen et al. Nat Commun. .

Abstract

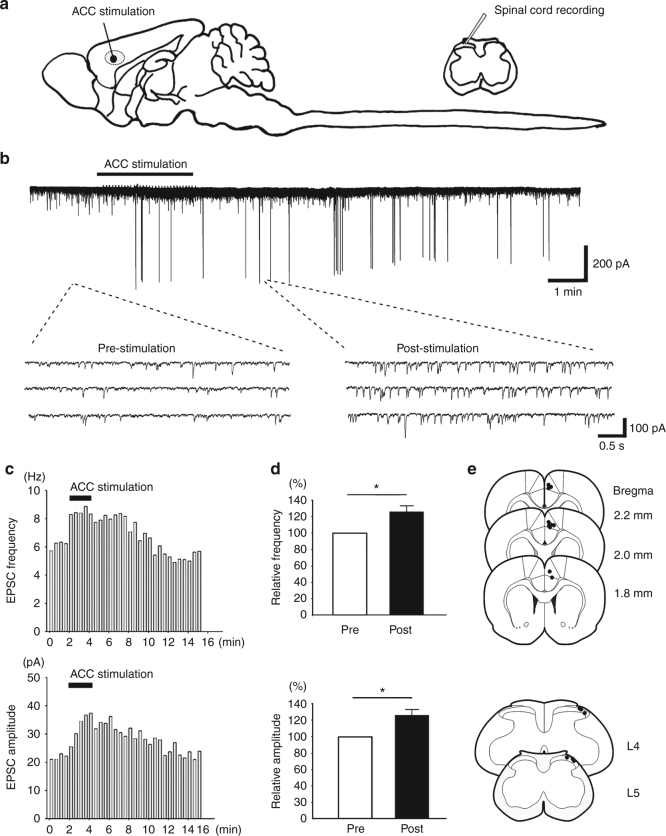
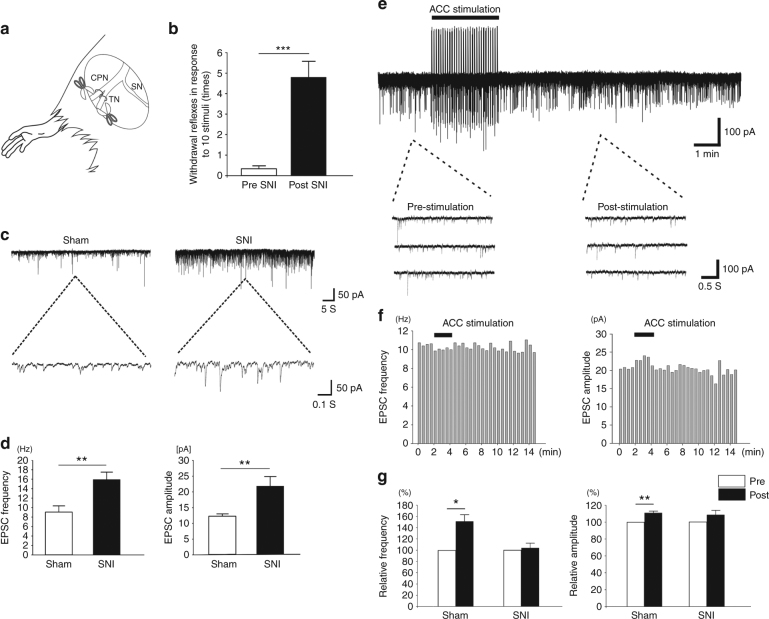
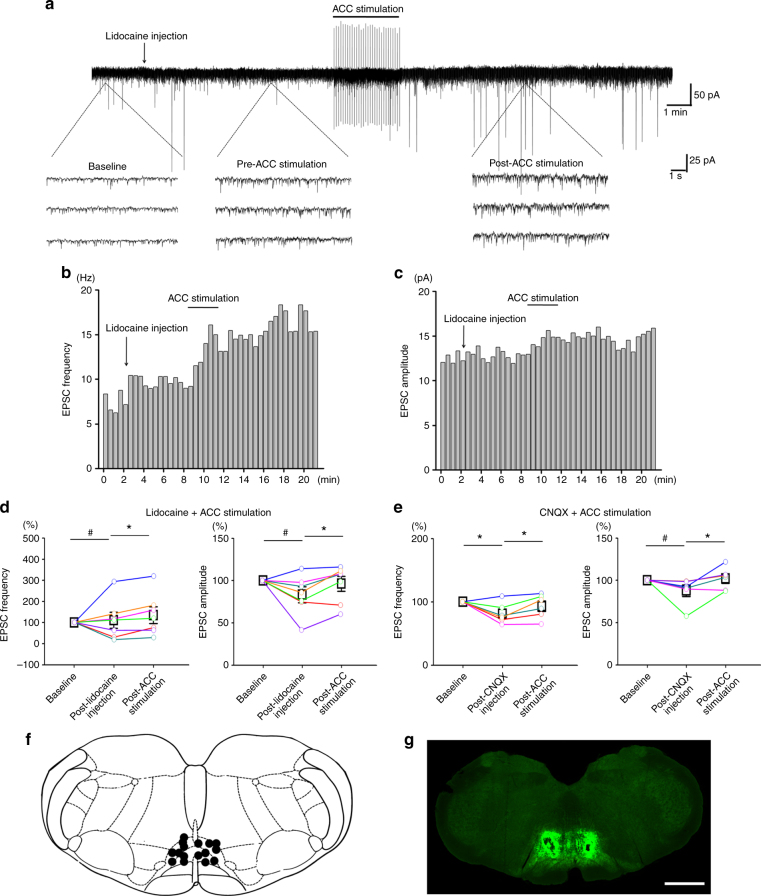
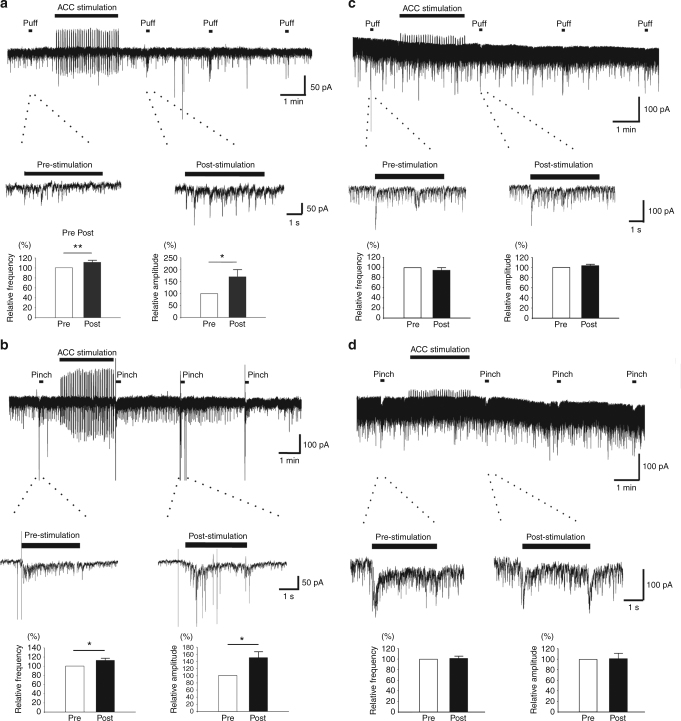
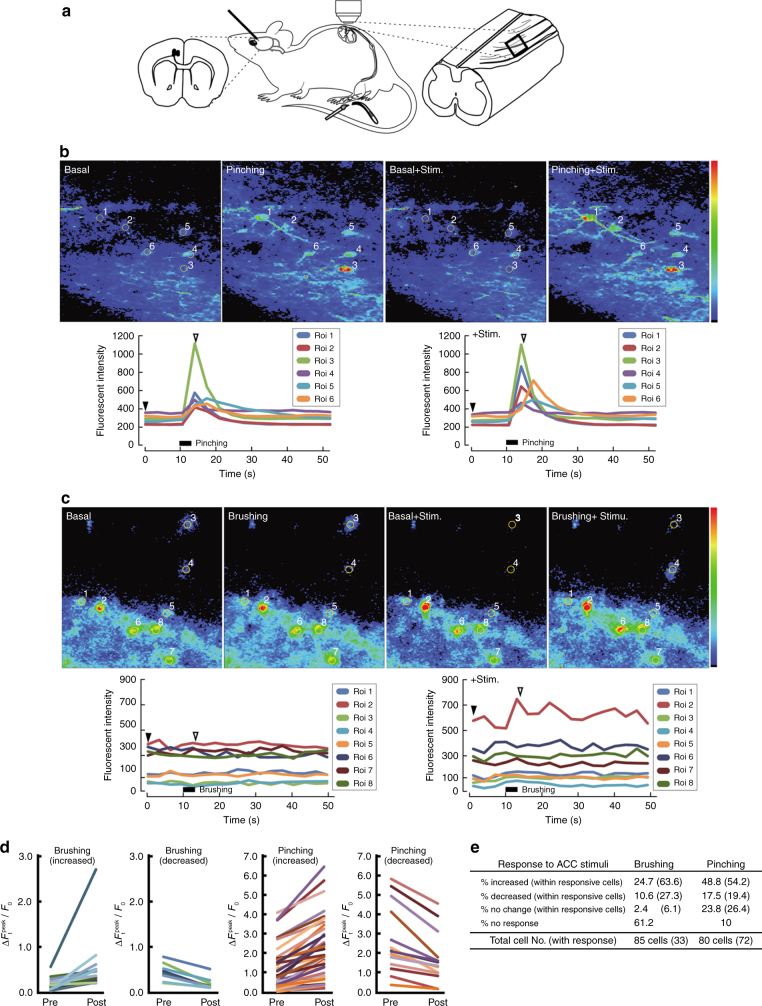
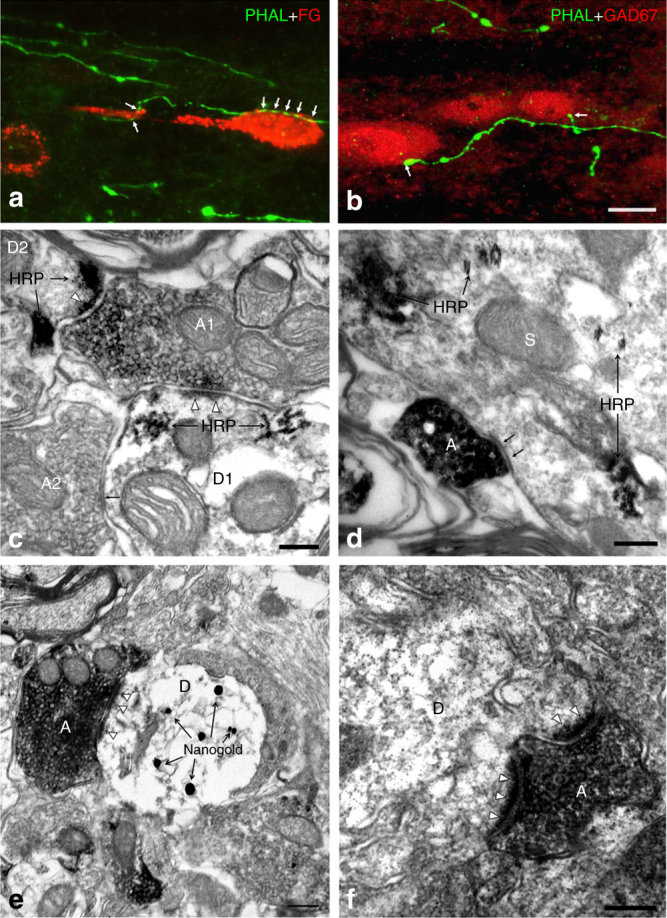
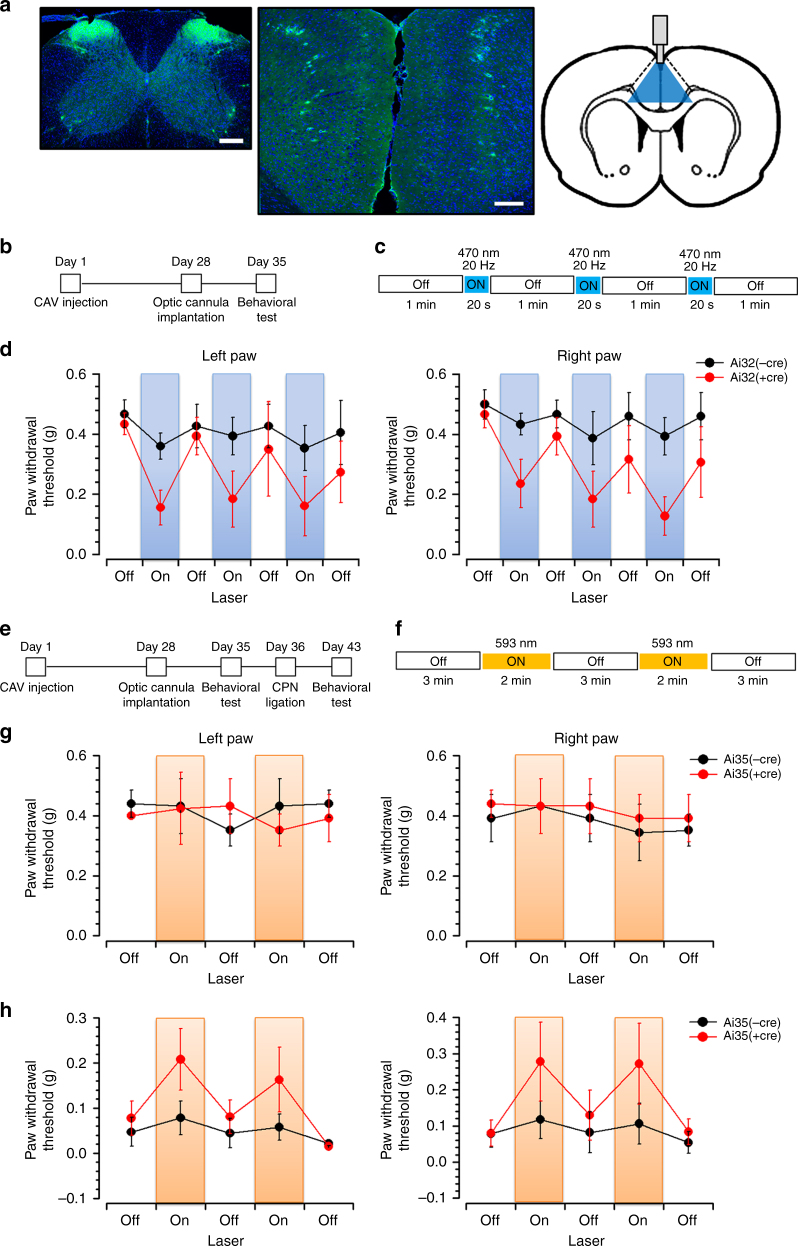
Spinal sensory transmission is under descending biphasic modulation, and descending facilitation is believed to contribute to chronic pain. Descending modulation from the brainstem rostral ventromedial medulla (RVM) has been the most studied, whereas little is known about direct corticospinal modulation. Here, we found that stimulation in the anterior cingulate cortex (ACC) potentiated spinal excitatory synaptic transmission and this modulation is independent of the RVM. Peripheral nerve injury enhanced the spinal synaptic transmission and occluded the ACC-spinal cord facilitation. Inhibition of ACC reduced the enhanced spinal synaptic transmission caused by nerve injury. Finally, using optogenetics, we showed that selective activation of ACC-spinal cord projecting neurons caused behavioral pain sensitization, while inhibiting the projection induced analgesic effects. Our results provide strong evidence that ACC stimulation facilitates spinal sensory excitatory transmission by a RVM-independent manner, and that such top-down facilitation may contribute to the process of chronic neuropathic pain.


Conflict of interest statement

The authors declare no competing interests.

Figures

Fig. 1
Fig. 1
ACC stimulation-induced facilitation of the sEPSCs on the SDH neurons. a A schematic diagram showing the experimental design for ACC electronic stimulation and in vivo spinal cord recording. bc One sample (b) and histogram figure (c) showing ACC stimulation-induced facilitation of the frequency and amplitude of the sEPSC. d Summarized results from 12 SDH neurons. *frequency: p = 0.01; amplitude: p = 0.03, paired t-test. e Mapping of the stimulation sites in the ACC and locations of recorded SDH neurons in the lumber spinal cord
Fig. 2
Fig. 2
Potentiated sEPSCs of SDH neurons and the occlusion of ACC-induced facilitation in rats with neuropathic pain. a A schematic diagram showing the SNI model. The tibial nerve (TN) and common peroneal nerve (CPN) were cut and ligated but leaving the sural nerve (SN) intact. b A significant mechanical allodynia was observed in rats 7 days after SNI surgery (pre SNI, 0.36 ± 0.25 times, post SNI, 4.82 ± 0.78 times, n = 11, ***p < 0.001, unpaired t-test). c Recording samples showing the frequency and amplitude of the sEPSCs of spinal SDH neurons in SNI rats were significantly potentiated than those in sham operated rats. d Summarized results from 20 SDH neurons in sham and SNI group, respectively. **frequency: p = 0.002; amplitude: p = 0.005, unpaired t-test. e One recording sample showing ACC electrical stimulation could not facilitate the sEPSCs of 1 SDH neuron in rats with SNI. f Histogram figures showing the frequency and amplitude of the sample sEPSCs in e before and after ACC stimulation. g Summarized results from 8 SDH neurons in sham group and nine neurons in SNI group. *frequency: p = 0.01; amplitude: p = 0.002, paired t-test
Fig. 3
Fig. 3
RVM blockade did not block ACC stimulation-induced potentiation of the spinal sEPSC in sham operated rats. ac One sample (a) and the histogram figures showing the frequency (b) and amplitude (c) of the spinal sEPSC with lidocaine blockade of RVM were potentiated by following ACC stimulation. d Summarized results from 7 SDH neurons with lidocaine injection and ACC stimulation. *frequency: p = 0.01; amplitude: p = 0.02. One-way RM ANOVA. e Summarized results from 6 SDH neurons with CNQX injection and ACC stimulation. *frequency: CNQX injection vs. baseline, p = 0.04, ACC stimuli vs. CNQX injection, p = 0.03; amplitude: p = 0.04. One-way RM ANOVA. fg Schematic diagram and sample figures showing the lidocaine injection sites on the RVM. #p > 0.05. Bar = 1 mm in g
Fig. 4
Fig. 4
RVM blockade did not reverse ACC stimulation-induced potentiation of the spinal sEPSC in sham operated rats. ac One sample (a) and the histogram figures showing the frequency (b) and amplitude (c) of the spinal sEPSC were potentiated by ACC stimulation, which could not be reversed by following lidocaine blockade of RVM. d Summarized results from 8 SDH neurons with ACC stimulation and lidocaine injection. *frequency: p = 0.03; amplitude: p = 0.04. One-way RM ANOVA. e Summarized results from 7 SDH neurons with ACC stimulation and CNQX injection. *frequency: p = 0.04; amplitude: p = 0.02. One-way RM ANOVA. #p > 0.05
Fig. 5
Fig. 5
RVM blockade and ACC stimulation did not affect the spinal sEPSC in SNI rats. ac One sample (a) and the histogram figures showing the frequency (b) and amplitude (c) of the spinal sEPSC was not affected by lidocaine blockade of RVM and following ACC stimulation. d Summarized results from 4 SDH neurons with lidocaine injection and ACC stimulation. e Summarized results from 4 SDH neurons with ACC stimulation and following lidocaine injection. #p > 0.05
Fig. 6
Fig. 6
ACC inhibition alleviated sEPSCs of SDH neurons in rats with SNI. a One recording sample showing ACC injection of NASPM didn’t change the basal sEPSCs of the SDH neurons in rats with sham surgery. b Histogram figure showing the frequency of the sample sEPSCs in a before and after NASPM injection. c Summarized results from 10 SDH neurons in sham rats. d One recording sample showing ACC injection of NASPM significantly inhibited the frequency but not the amplitude of the sEPSCs of spinal SDH neurons from rats with SNI. e Histogram figure shows the frequency of the sEPSC of 1 SDH neuron before and after NASPM injection. f Summarized results from 6 SDH neurons in SNI rats. *p = 0.03, paired t-test
Fig. 7
Fig. 7
ACC stimulation potentiated the primary afferent stimulation induced EPSC of SDH neurons. a One recording sample and summarized results (9 SDH neurons) showing that ACC electrical stimulation increased the frequency and amplitude of puff induced EPSC. *p = 0.04; **p = 0.006, paired t-test. b One sample and summarized results (10 SDH neurons) showing ACC electrical stimulation increased the frequency and amplitude of pinch induced EPSC. *frequency: p = 0.04; amplitude: p = 0.03, paired t-test. c One sample and summarized results (7 SDH neurons) showing ACC electrical stimulation did not affect the frequency and amplitude of puff induced EPSC. d One recording sample and summarized results (7 SDH neurons) showing ACC electrical stimulation did not affect the pinch induced EPSC
Fig. 8
Fig. 8
In vivo Ca2+ imaging of spinal dorsal horn neurons. a A scheme of experimental setup. Two-photon imaging of SDH was performed through custom built implanted imaging chamber and electrode was inserted into one side of ACC after a small craniotomy. Pinching and brushing were applied to the contralateral hindpaw. bc Representative image showing the Ca2+ responses before and after pinching/brushing and ACC stimuli. Raw fluorescent intensity was pseudo-colored and region of interests were numbered. Changes of intensity were plotted under the images and corresponding time points to images were indicated by open arrow head (Pinching/Brushing) and closed arrow head (basal). Roi 1, 2, 6 in b and Roi 1, 2, 4 in c were identified neurons with potentiated responses to ACC stimulation; Roi 3 or Roi 4, 5 in b were neurons with alleviated or no changed responses. Roi 3, 4, 6–8 in c have no responses to brushing. d Maximal Ca2+ response to brushing and pinching in each cells indicated as ΔFt/F0 were plotted at pre-ACC and post-ACC stimulation. Data were separately plotted on the basis of the effect of ACC stimulation (increase or decrease). e Summarized results of identified cells before and after pinching/brushing and ACC stimuli
Fig. 9
Fig. 9
ACC-spinal cord projecting fibers and terminals connected with SDH neurons. ab One Alexa-488-labeled PHA-L-IR fiber (for PHA-L injected into the contralateral side of ACC) made close connection with one cy3 re-stained FG-labeled spinal lamina I neuron (for FG injection into the contralateral PBN) (a) or two cy3-labeled GAD67-IR neurons in spinal lamina II (b). c One DAB stained PHA-L containing axon (A1) made asymmetric synapses with two HRP-labeled dendritic spines (D1, 2), noting that the axon terminal mainly contained round and clear vesicles. An immunonegative axon (A2) also made symmetric synapse with D1, noting the axon terminal mainly contained flat and clear vesicles. d One PHA-L containing axon made symmetric synapse with one HRP-labeled soma (S). ef One PHA-L containing axon made asymmetric synapses with one nanogold-labeled GAD67-IR (e) or immunonegative dendritic spine (f). Arrows in ab indicate the close connection sites, in cd indicate the symmetric synapses. Triangles point to the asymmetric synaptic regions. Bars equal to 10 µm in ab, 200 nm in cf
Fig. 10
Fig. 10
Activation of ACC-spinal cord projecting neurons contributed to mechanical pain sensitization. a Photos showing the CAV2-cre injection sites in bilateral spinal dorsal horns (left) and the CAV2-cre infected neurons in both sides of the ACC (middle) in Ai32 mice. Diagram showing the optic cannula implantation in the middle side of the ACC. Bars equal to 200 μm. b Schematics showing the timeline of experiments for CAV2-cre injection into the spinal cord, optic cannula implantation into the ACC, and behavioral test in Ai32 mice. c The procedure for optogenetic modulation during the mechanical pain threshold test. Blue light stimuli (470 nm, 20 Hz) were delivered during the “on” session and repeated for 3 time with 1 min intervals. d Blue light stimulation reduced the paw withdrawal threshold in both left and right hind paws of Ai32 (+cre) but not Ai32 (−cre) mice. e Schematics showing the timeline of experiments in Ai35 mice. f The procedure for optogenetic modulation during the mechanical pain threshold test. Yellow light stimuli (590 nm) were delivered continuously during the “on” session and repeated for 2 time with 3 min interval. g Yellow light stimulation had no effect on the paw withdrawal threshold in normal Ai35 (+cre) and Ai35 (−cre) mice. h Yellow light stimulation inhibited the allodynia in Ai35 (+cre) but not Ai35 (−cre) mice after CPN ligation

References

    1. Gebhart GF. Descending modulation of pain. Neurosci. Biobehav. Rev. 2004;27:729–737. doi: 10.1016/j.neubiorev.2003.11.008. - DOI - PubMed
    1. Porreca F, Ossipov MH, Gebhart GF. Chronic pain and medullary descending facilitation. Trends Neurosci. 2002;25:319–325. doi: 10.1016/S0166-2236(02)02157-4. - DOI - PubMed
    1. Robinson DA, Calejesan AA, Wei F, Gebhart GF, Zhuo M. Endogenous facilitation: from molecular mechanisms to persistent pain. Curr. Neurovasc. Res. 2004;1:11–20. doi: 10.2174/1567202043480189. - DOI - PubMed
    1. Fields H. State-dependent opioid control of pain. Nat. Rev. Neurosci. 2004;5:565–575. doi: 10.1038/nrn1431. - DOI - PubMed
    1. Zhuo M, Gebhart GF. Characterization of descending facilitation and inhibition of spinal nociceptive transmission from the nuclei reticularis gigantocellularis and gigantocellularis pars alpha in the rat. J. Neurophysiol. 1992;67:1599–1614. doi: 10.1152/jn.1992.67.6.1599. - DOI - PubMed

Publication types

MeSH terms