. 2018 Jun;21(6):843-850.
doi: 10.1038/s41593-018-0150-0. Epub 2018 May 14.

Two distinct mechanisms for experience-dependent homeostasis

Affiliations

Two distinct mechanisms for experience-dependent homeostasis

Michelle C D Bridi et al. Nat Neurosci. 2018 Jun.

Abstract

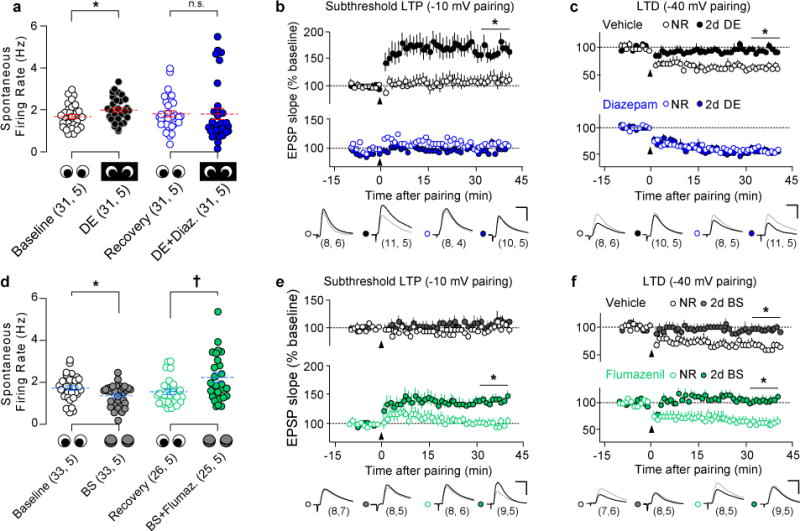
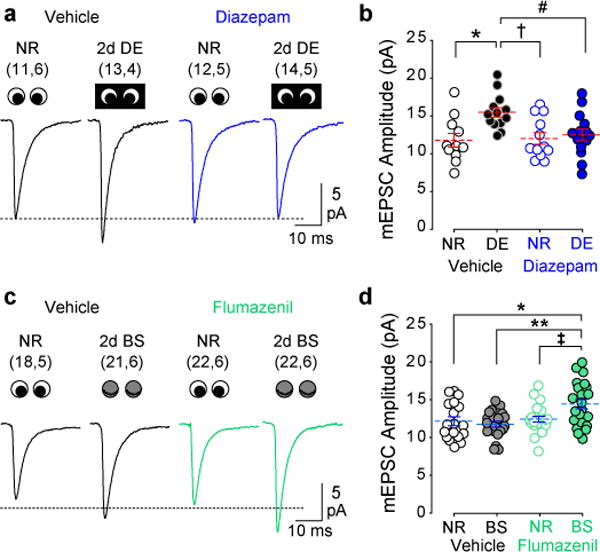
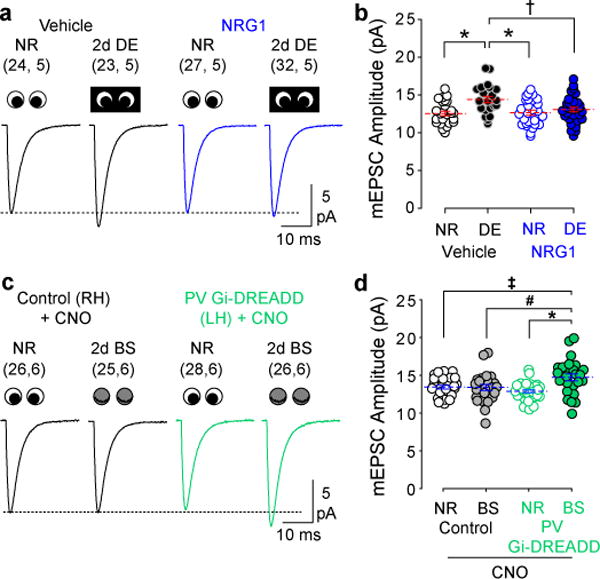
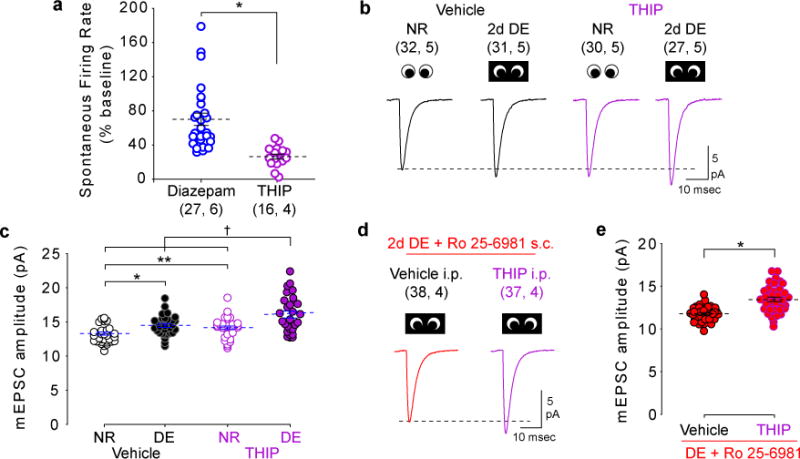
Models of firing rate homeostasis such as synaptic scaling and the sliding synaptic plasticity modification threshold predict that decreasing neuronal activity (for example, by sensory deprivation) will enhance synaptic function. Manipulations of cortical activity during two forms of visual deprivation, dark exposure (DE) and binocular lid suture, revealed that, contrary to expectations, spontaneous firing in conjunction with loss of visual input is necessary to lower the threshold for Hebbian plasticity and increase miniature excitatory postsynaptic current (mEPSC) amplitude. Blocking activation of GluN2B receptors, which are upregulated by DE, also prevented the increase in mEPSC amplitude, suggesting that DE potentiates mEPSCs primarily through a Hebbian mechanism, not through synaptic scaling. Nevertheless, NMDA-receptor-independent changes in mEPSC amplitude consistent with synaptic scaling could be induced by extreme reductions of activity. Therefore, two distinct mechanisms operate within different ranges of neuronal activity to homeostatically regulate synaptic strength.


Conflict of interest statement

Competing Financial Interests: The authors have no competing financial interests.

Figures

Figure 1
Figure 1. Deprivation-induced metaplasticity does not depend on reduced firing rates
(A) Spontaneous firing rates of regular spiking single units (in response to presentation of blank screen) recorded in V1 of awake, head-fixed mice. DE increased the rate of spontaneous activity, which was blocked by diazepam treatment during DE. *P=0.035; 2-tailed Wilcoxon rank sum test. (B) DE promoted the induction of LTP with a subthreshold pairing protocol (pairing at −10 mV), which was blocked by diazepam treatment during DE. *P≤0.001, DE+vehicle vs. NR+vehicle, NR+diazepam, and DE+diazepam; One-way ANOVA followed by Holm-Sidak post-hoc test. (C) DE impaired LTD induction (pairing at −40 mV). Diazepam prevented this effect of DE. *P≤0.001, DE+vehicle vs. NR+vehicle, NR+diazepam, and DE+diazepam; One-way ANOVA followed by Holm-Sidak post-hoc test. (D) Spontaneous single unit activity was decreased by binocular lid suture (BS) alone, and increased by flumazenil treatment during BS. *P=0.023, †P=0.015; 2-tailed Wilcoxon rank sum test. (E) BS alone did not affect pairing-induced LTP, but flumazenil treatment during BS enabled LTP induction. *P≤0.001, BS+flumazenil vs. NR+vehicle, NR+flumazenil, and BS+vehicle, One-way ANOVA followed by Holm-Sidak post-hoc test. (F) BS, alone or combined with flumazenil, impaired pairing-induced LTD. *P≤0.001, BS (+/− flumazenil) vs. NR (+/− flumazenil), One-way ANOVA followed by Holm-Sidak post-hoc test. Single unit data are displayed as average±SEM (blue lines) and individual data points were displaced horizontally for clarity. Representative traces of baseline (gray) and post-LTP/LTD (black) EPSPs are shown; scale bar: 15 msec, 4 mV. Sample size is indicated in parentheses (neurons, mice).
Figure 2
Figure 2. Deprivation-induced up-regulation of mEPSC amplitude does not depend on reduced firing rates
(A) Average mEPSC waveforms in normal reared (NR) and DE mice with and without diazepam treatment. (B) The DE-induced increase mEPSC amplitude observed in control, vehicle-treated mice was blocked by diazepam treatment during DE. *P=0.002, †P=0.003, #P=0.007, One-way ANOVA followed by Holm-Sidak post-hoc test. (C) Average mEPSC waveforms in NR and BS mice with and without flumazenil treatment. (D) BS alone did not increase mEPSC amplitude in control, vehicle-treated mice. However, flumazenil treatment during BS increased mEPSC amplitude. *P=0.002, **P≤0.001, ‡P=0.004, One-way ANOVA followed by Holm-Sidak post-hoc test. Blue lines indicate mean±SEM; individual data points were displaced horizontally for clarity. Sample size is indicated in parentheses (neurons, mice).
Figure 3
Figure 3. Manipulations of PV IN activity regulate the deprivation-induced increase in mEPSC amplitude
(A) Average mEPSC waveforms in normal reared (NR) and DE subjects with and without NRG1 treatment. (B) The DE-induced increase in mEPSC amplitude was blocked by NRG1 treatment. *P≤0.001, †P≤0.006, One-way ANOVA followed by Holm-Sidak post-hoc test. (C) Average mEPSC waveforms in NR and BS subjects with and without chemogenetic suppression of PV IN activity (CNO i.p. 2×/day; See Supplementary Fig. 5). (D) BS did not increase mEPSC amplitude in control hemispheres (no Gi-DREADD injection). In the injected hemispheres, activation of Gi-DREADD in PV INs during BS increased mEPSC amplitude. *P≤0.001, #P=0.008, ‡P=0.009; One-way ANOVA followed by Holm-Sidak post-hoc test. Blue lines indicate mean±SEM; some data points were displaced horizontally for clarity. Sample size is indicated in parentheses (neurons, subjects).
Figure 4
Figure 4. Spontaneous activity is required for the DE-mediated increase in GluN2B, which in turn is necessary for increased mEPSC amplitude
(A) DE increased GluN2B function in vehicle-treated animals, revealed by an increase in the percent of NMDA receptor current amplitude blocked by ifenprodil (3μM) and an increase in the weighted NMDA receptor current decay constant (τw; see Methods). Solid lines: average baseline NMDAR current; dashed lines: after ifenprodil. Traces are normalized to baseline. *P=0.024; †P≤0.001, 2-tailed t test. (B) Diazepam treatment during DE prevented the increase in GluN2B function. Solid lines: average baseline NMDAR current; dashed lines: after ifenprodil. Traces are normalized to baseline. (C) The GluN2B-specific antagonist Ro 25-6981 or vehicle was administered via osmotic minipump during NR or DE. Averaged mEPSCs are shown for each group. (D) DE increased the mEPSC amplitude in vehicle-treated mice. Ro 25-6981 treatment prevented this increase. *P=0.003; †P≤0.001, One-way ANOVA followed by Holm-Sidak post-hoc test. Plots of individual data points are displaced horizontally for clarity; dashed lines indicate average (±SEM). Sample size is indicated in parentheses (neurons, mice).
Figure 5
Figure 5. Synaptic scaling is engaged by extreme reductions in neuronal activity
(A) THIP induced a larger decrease in spontaneous firing than diazepam (Diazepam: 70.0±7.3%; THIP: 26.2±3.0% of baseline). *P≤0.001, 2-tailed Wilcoxon rank sum test. (B) Average mEPSC waveforms from NR and DE mice treated with vehicle or THIP. (C) Compared to vehicle, THIP increased mEPSC amplitude in NR controls. THIP during DE further increased mEPSC amplitude over DE or THIP alone. *P=0.002; **P=0.017; †P≤0.001, One-way ANOVA followed by Holm-Sidak post-hoc test. (D) Average mEPSC waveforms from DE mice treated with Ro 25-6981 with and without THIP. (E) Ro 25-6981 did not prevent THIP-induced upscaling of mEPSC amplitude. *P≤0.001, 2-tailed t test. Dashed lines indicate mean (±SEM). Some data points have been displaced horizontally for clarity. Sample size is indicated in parentheses (neurons, mice).
Figure 6
Figure 6. Model depicting two distinct mechanisms that increase mEPSC amplitude in response to decreased neuronal activity
When neuronal activity varies within the normal physiological range, such as during DE, the change in temporal activity patterns (evoked spikes: red; spontaneous: blue) increase the expression of GluN2B and slide the plasticity threshold to favor LTP. After the threshold is lowered, spontaneous activity is sufficient to induce LTP, causing synaptic AMPA receptor insertion and increased mEPSC amplitude. In contrast, when neuronal activity is near zero, the neuron cannot engage Hebbian plasticity mechanisms (purple box). In this case synaptic scaling mechanisms increase mEPSC amplitude.

Comment in

References

    1. Marder E, O’Leary T, Shruti S. Neuromodulation of circuits with variable parameters: single neurons and small circuits reveal principles of state-dependent and robust neuromodulation. Annu Rev Neurosci. 2014;37:329–46. - PubMed
    1. Davis GW. Homeostatic control of neural activity: From phenomenology to molecular design. Annu Rev Neurosci. 2006;29:307–323. - PubMed
    1. Turrigiano GG. The self-tuning neuron: Synaptic scaling of excitatory synapses. Cell. 2008;135:422–435. - PMC - PubMed
    1. Cooper LN, Bear MF. The BCM theory of synapse modification at 30: Interaction of theory with experiment. Nat Rev Neurosci. 2012;13:798–810. - PubMed
    1. Abraham WC, Bear MF. Metaplasticity: The plasticity of synaptic plasticity. Trends Neurosci. 1996;19:126–130. - PubMed

Publication types