. 2018 Apr 30:11:137.
doi: 10.3389/fnmol.2018.00137. eCollection 2018.

Characterization of Wnt and Notch-Responsive Lgr5+ Hair Cell Progenitors in the Striolar Region of the Neonatal Mouse Utricle

Affiliations

Characterization of Wnt and Notch-Responsive Lgr5+ Hair Cell Progenitors in the Striolar Region of the Neonatal Mouse Utricle

Dan You et al. Front Mol Neurosci. .

Abstract

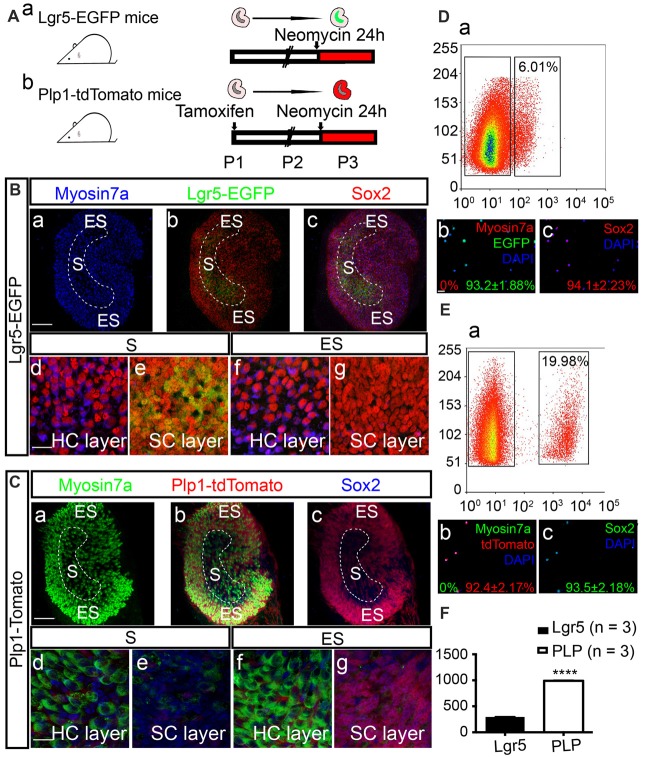
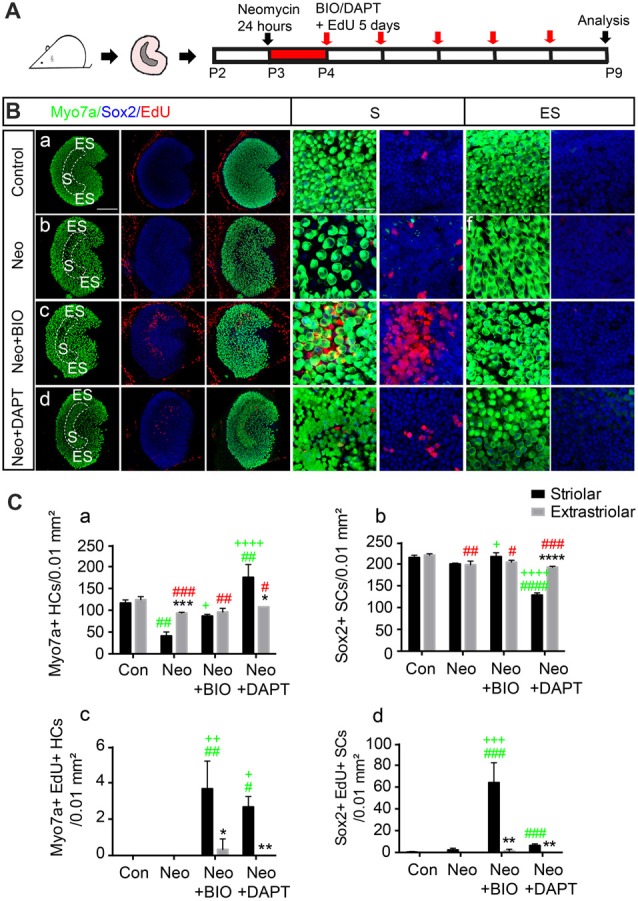
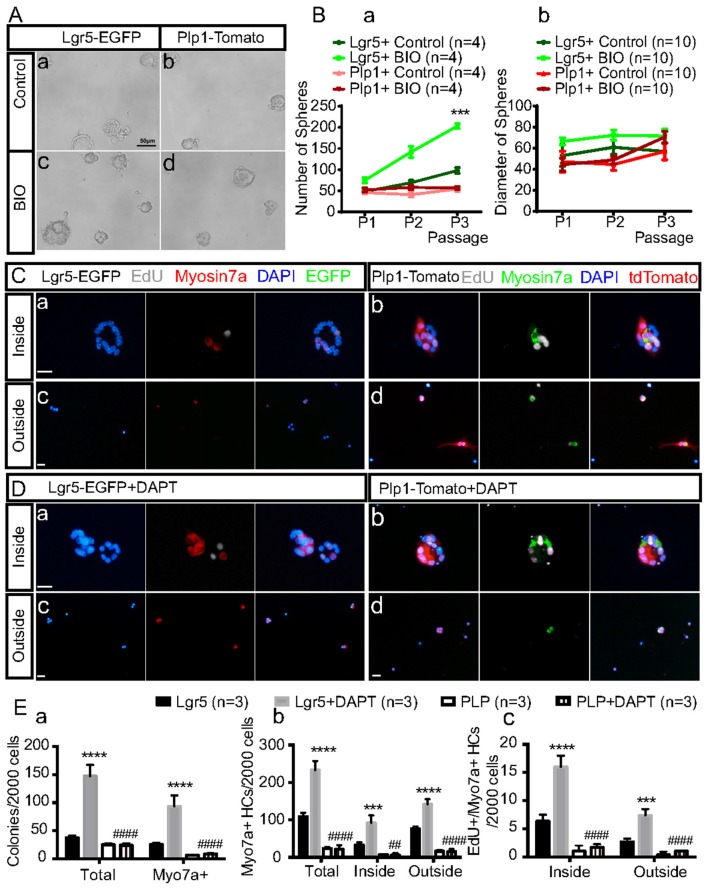
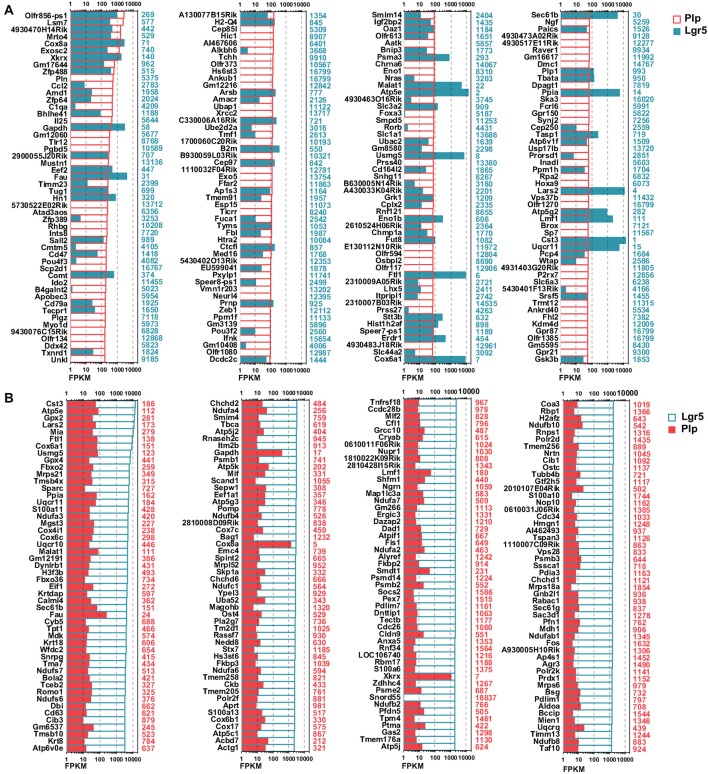
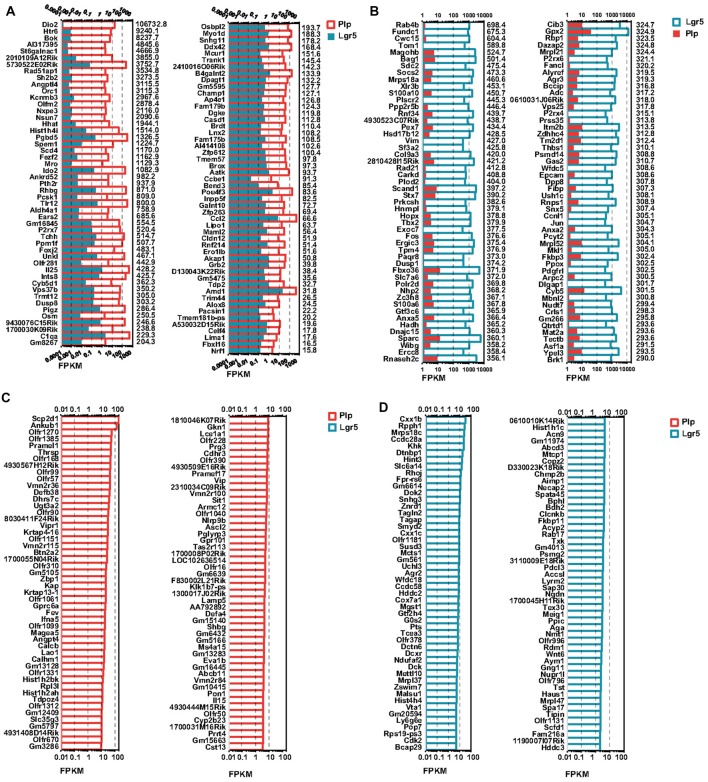
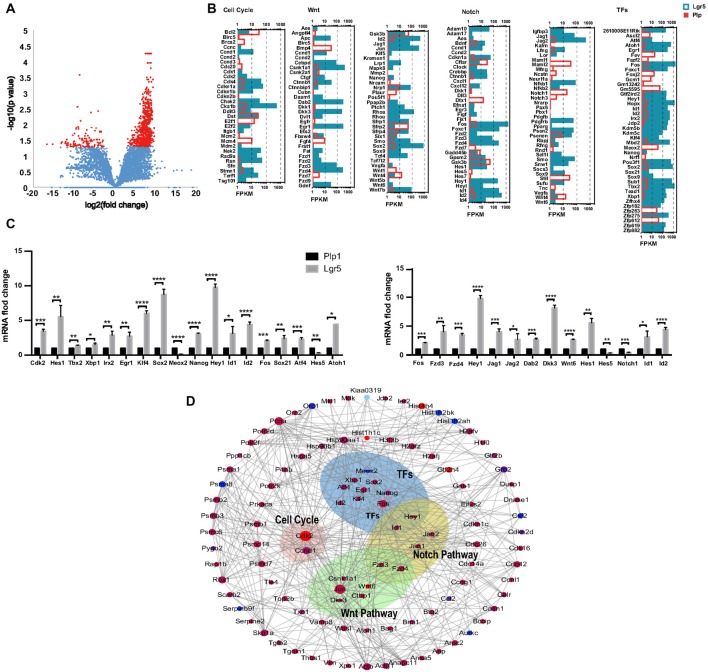
Dysfunctions in hearing and balance are largely connected with hair cell (HC) loss. Although regeneration of HCs in the adult cochlea does not occur, there is still limited capacity for HC regeneration in the mammalian utricle from a distinct population of supporting cells (SCs). In response to HC damage, these Lgr5+ SCs, especially those in the striolar region, can regenerate HCs. In this study, we isolated Lgr5+ SCs and Plp1+ SCs (which originate from the striolar and extrastriolar regions, respectively) from transgenic mice by flow cytometry so as to compare the properties of these two subsets of SCs. We found that the Lgr5+ progenitors had greater proliferation and HC regeneration ability than the Plp1+ SCs and that the Lgr5+ progenitors responded more strongly to Wnt and Notch signaling than Plp1+ SCs. We then compared the gene expression profiles of the two populations by RNA-Seq and identified several genes that were significantly differentially expressed between the two populations, including genes involved in the cell cycle, transcription and cell signaling pathways. Targeting these genes and pathways might be a potential way to activate HC regeneration.

Keywords: hearing and balance; regeneration; stem cell; supporting cells; utricle.


Figures

Figure 1
Figure 1
Expression patterns of Lgr5 and Plp in the utricle after neomycin damage. (A) Tamoxifen was injected into Plp1-CreERT-tdTomato mice on P1 to activate Cre recombinase. Utricles from both Lgr5-EGFP-CreERT mice (Aa) and Plp1-CreERT-tdTomato mice (Ab) were isolated for culture on P2. The utricles were cultured with neomycin for 24 h and then collected for analysis on P3. (B,C) Images showing the Lgr5-EGFP and Plp1-tdTomato expression patterns in utricles. High-magnification images show the hair cell (HC) nuclear layer and supporting cell (SC) nuclear layer of both the striolar region (S) and extrastriolar region (ES; Bd–g,Cd–g). After 24 h of neomycin exposure, HC death was observed primarily in the striolar region (Ba,Ca). Neomycin-induced HC damage activated SCs to re-express Lgr5-EGFP in the same region (Bb,c,Be), and tdTomato mainly labeled SCs in the extrastriolar region in Plp-CreERT-tdTomato mice (Cbc,Cg). (D,E) Lgr5-EGFP+ SCs and Plp1-tdTomato+ SCs were isolated by fluorescence activated cell sorting (FACS). The percentage of Lgr5-EGFP+ cells was 6.02% (Da), and the percentage of Plp1-tdTomato+ cells was 19.98% (Ea). Immunostaining confirmed that purified Lgr5+ cells robustly expressed EGFP (93.2% ± 1.88%) and Sox2 (94.1% ± 2.33%), but not the HC marker Myosin7a (0.0%; Db,c). Of the isolated Plp1+ cells, 92.4% ± 1.2% were tdTomato+, 93.5% ± 2.18% were Sox2+, and none were Myosin7a+ (Eb,c). (F) The numbers for Lgr5-EGFP+ and Plp1-tdTomato+ cells per utricle. Data are shown as the mean ± SD; t-test, ****p < 0.001, n = 3. Scale bars are 100 μm in (Ba–c) and (Ca–c) and 20 μm in (Bd–g,Cd–g,Db,c,Eb,c).
Figure 2
Figure 2
Subset of SCs in the striolar and extrastriolar region in response to Wnt and Notch signaling in vitro. (A) Schematic of the experimental procedure. (B) Utricles from control (a), neomycin (b), neomycin+6-Bromoindirubin-3′-oxime (BIO; c), and neomycin+N-[N-(3,5-difluorophenacetyl)-l-alanyl]-S-phenylglycine t-butyl ester (DAPT; d) groups were dissected and cultured. 5′-ethynyl-2′-deoxyuridine (EdU) was used to label the proliferating cells. All images are low-magnification images showing cultured utricles in the different treatment groups. High-magnification slices show the HC nuclear layer and SC nuclear layer of both the striolar and extrastriolar regions. (C) Quantification of Myosin7a+, Sox2+ and EdU+ cells in the striolar and extrastriolar regions in each group (Ca–d). Data are shown as the mean ± SD. *p < 0.05, **p < 0.01, ***p < 0.001, ****p < 0.0001 (Striolar vs. Extrastriolar). #(Green) p < 0.05, ##p < 0.01, ###p < 0.001, ####p < 0.0001 (Neo, Neo+BIO, Neo+DAPT vs. Con in Striolar). +p < 0.05, ++p < 0.01, +++p < 0.001, ++++p < 0.0001 (Neo+BIO, Neo+DAPT vs. Neo in Striolar). #(Red) p < 0.05, ##p < 0.01, ###p < 0.001, ####p < 0.0001 (Neo, Neo+BIO, Neo+DAPT vs. Con in Extrastriolar). In (B), n = 3. Scale bars are 100 μm in the low-magnification images and 20 μm in the high-magnification images in (B).
Figure 3
Figure 3
Sorted Lgr5+ SCs and Plp1+ SCs during sphere formation and HC differentiation in response to Wnt and Notch signaling in vitro. (A) Activation of the Wnt signaling pathway with BIO during neurosphere formation from the first generation in both subsets of purified SCs in vitro (Ac,d). The control group was cultured only with media (Aa,b). (B) Quantification of the sphere number (Ba) and sphere diameter (Bb) formed from both subsets of SCs in the BIO and control group over the first three generations ***p < 0.001 (Lgr5+Control vs. Lgr5+BIO). (C,D) HC differentiation assay with purified Lgr5+ (Ca,c,Da,c) or Plp1+ (Cb,d,Db,d) SCs in the presence of Notch inhibition by DAPT. The inside of the colonies represents the mitotically regenerated HCs (Ca,b,Da,b), and the outside of the colonies represents the directly differentiated HCs (Cc,d,Dc,d). (E) Quantification of total colonies, Myosin7a+ colonies and Myosin7a+ cells and Myosin7a+/EdU+ cells both inside and outside the colonies. Data are shown as the mean ± SD. ***p < 0.001, ****p < 0.0001 (Lgr5 vs. Lgr5+DAPT).##p < 0.01, ####p < 0.0001 (Lgr5+DAPT vs. PLP+DAPT). In (Ba), n = 4. In (Bb), n = 10. In (E), n = 3. Scale bars are 50 μm in (A) and 20 μm in (C,D).
Figure 4
Figure 4
Top expressed genes in Lgr5+ and Plp1+ SCs. (A) The expression levels of the top 200 genes in Plp1+ SCs in descending order. The length of the bar after each gene represents its Fragments Per Kilobase of transcript per Million fragments mapped (FPKM) value. The numbers on the right side of each panel represent the rankings of the same genes in Lgr5+ SCs. (B) The expression levels of the top 200 genes in Lgr5+ SCs in descending order. The length of the bar after each gene represents its FPKM value. The numbers on the right side of each panel represent the rankings of the same genes in Plp1+ SCs.
Figure 5
Figure 5
Differentially and uniquely expressed genes in Lgr5+ SCs and Plp1+ SCs. (A) The top 100 most differentially expressed genes in Plp1+ SCs. The numerical values on the right side of each panel represent the fold difference in expression for Plp1+ SCs vs. Lgr5+ SCs. (B) The top 100 most differentially expressed genes in Lgr5+ SCs. The numerical values on the right side of each panel represent the fold difference in expression for Lgr5+ SCs vs. Plp1+ SCs. (C) The 100 uniquely expressed genes in Plp1+ SCs. The numerical values on the right side of each panel represent the fold difference in expression for Plp1+ SCs vs. Lgr5+ SCs. (D) The 100 uniquely expressed genes in Lgr5+ SCs. The numerical values on the right side of each panel represent the fold difference in expression for Lgr5+ SCs vs. Plp1+ SCs. The length of the bar after each gene represents its FPKM value.
Figure 6
Figure 6
Wnt and Notch signaling pathway gene expression and cooperation between Lgr5+ SCs and Plp1+ SCs. (A) The volcano plot reflects the overall gene expression. The orange dots represent the differentially expressed genes, and the blue dots represent the non-differentially expressed genes. (B) The expression levels of genes involved in cell cycle regulation, the Wnt signaling pathway, the Notch signaling pathway, and transcription factors (TFs). The length of the bar after each gene represents its FPKM value. (C) Real-time PCR-validated differentially expressed genes involved in the cell cycle, TFs, and the Wnt and Notch signaling pathways. *p < 0.05, **p < 0.01, ***p < 0.001, ****p < 0.0001. (D) Gene interaction analysis of differentially expressed genes in Lgr5+ SCs (red) and Plp+ SCs (blue).

Similar articles

Cited by

References

    1. Alvarado D. M., Veile R., Speck J., Warchol M., Lovett M. (2009). Downstream targets of GATA3 in the vestibular sensory organs of the inner ear. Dev. Dyn. 238, 3093–3102. 10.1002/dvdy.22149 - DOI - PMC - PubMed
    1. Asamura K., Abe S., Fukuoka H., Nakamura Y., Usami S. (2005). Mutation analysis of COL9A3, a gene highly expressed in the cochlea, in hearing loss patients. Auris Nasus Larynx 32, 113–117. 10.1016/j.anl.2005.01.011 - DOI - PubMed
    1. Baier B., Vogt T., Rohde F., Cuvenhaus H., Conrad J., Dieterich M. (2017). Deep brain stimulation of the nucleus ventralis intermedius: a thalamic site of graviceptive modulation. Brain Struct. Funct. 222, 645–650. 10.1007/s00429-015-1157-x - DOI - PubMed
    1. Barker N., van Es J. H., Kuipers J., Kujala P., van den Born M., Cozijnsen M., et al. . (2007). Identification of stem cells in small intestine and colon by marker gene Lgr5. Nature 449, 1003–1007. 10.1038/nature06196 - DOI - PubMed
    1. Bermingham N. A., Hassan B. A., Price S. D., Vollrath M. A., Ben-Arie N., Eatock R. A., et al. . (1999). Math1: an essential gene for the generation of inner ear hair cells. Science 284, 1837–1841. 10.1126/science.284.5421.1837 - DOI - PubMed

LinkOut - more resources