

Omics-based responses induced by bosentan in human hepatoma HepaRG cell cultures
- PMID: 29761207
- PMCID: PMC6173297
- DOI: 10.1007/s00204-018-2214-z
Omics-based responses induced by bosentan in human hepatoma HepaRG cell cultures
Abstract
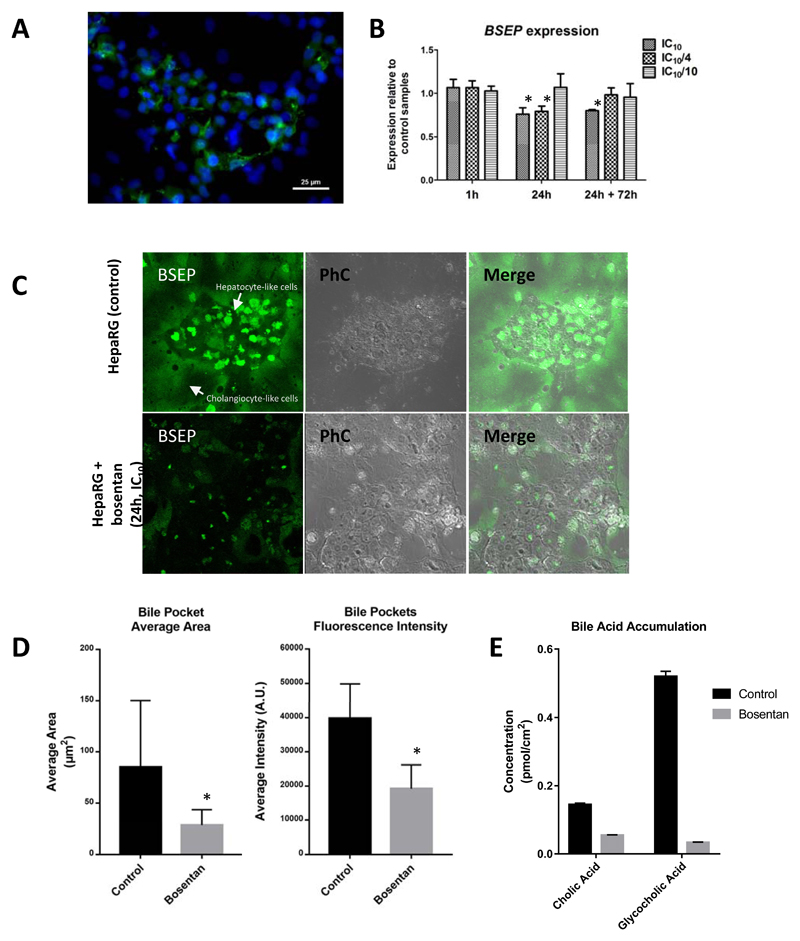
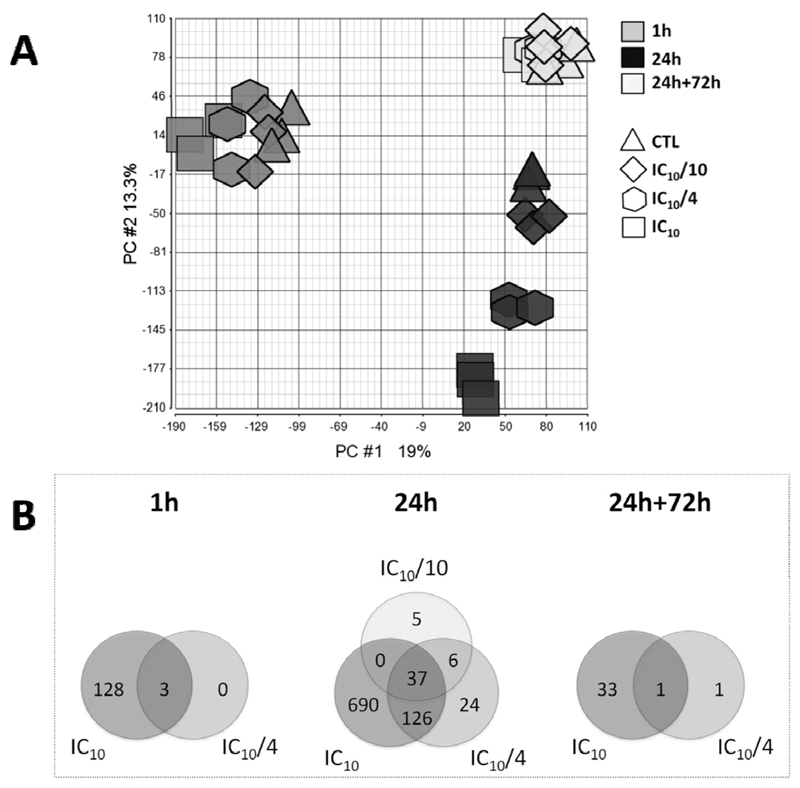
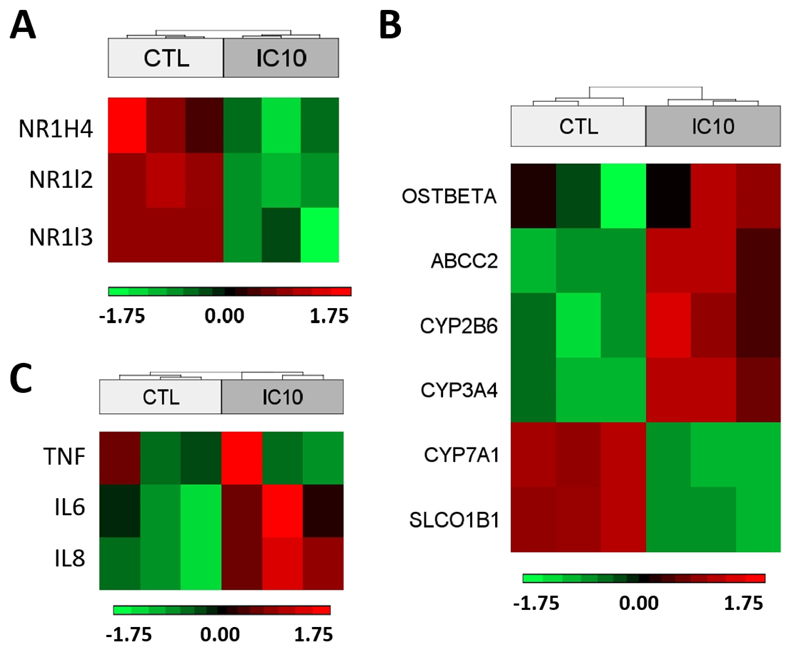
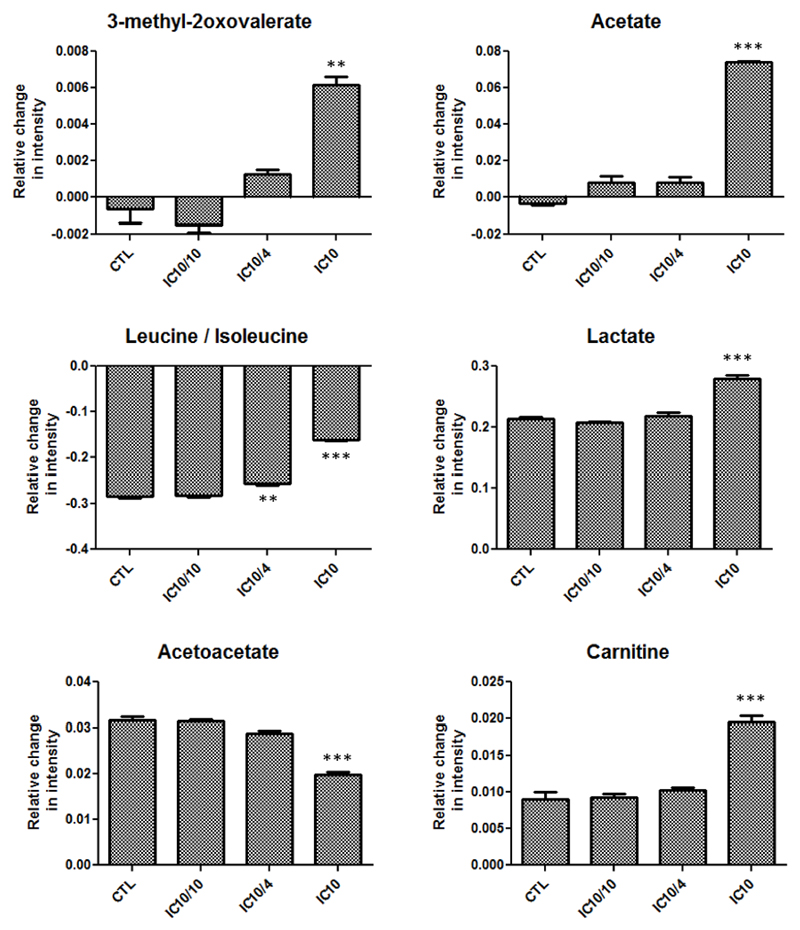
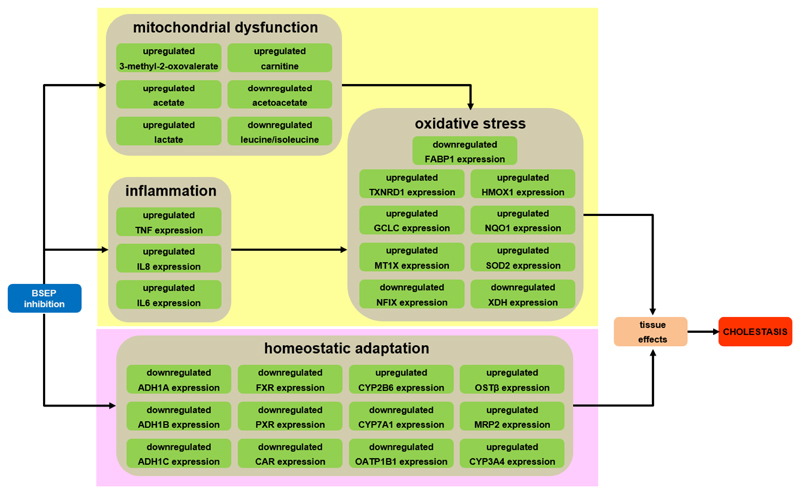
Bosentan is well known to induce cholestatic liver toxicity in humans. The present study was set up to characterize the hepatotoxic effects of this drug at the transcriptomic, proteomic, and metabolomic levels. For this purpose, human hepatoma-derived HepaRG cells were exposed to a number of concentrations of bosentan during different periods of time. Bosentan was found to functionally and transcriptionally suppress the bile salt export pump as well as to alter bile acid levels. Pathway analysis of both transcriptomics and proteomics data identified cholestasis as a major toxicological event. Transcriptomics results further showed several gene changes related to the activation of the nuclear farnesoid X receptor. Induction of oxidative stress and inflammation were also observed. Metabolomics analysis indicated changes in the abundance of specific endogenous metabolites related to mitochondrial impairment. The outcome of this study may assist in the further optimization of adverse outcome pathway constructs that mechanistically describe the processes involved in cholestatic liver injury.
Keywords: Adverse outcome pathway.; BSEP; Bosentan; Cholestasis; HepaRG; Metabolomics; Proteomics; Transcriptomics.
Figures
Similar articles
-
Disruption of BSEP Function in HepaRG Cells Alters Bile Acid Disposition and Is a Susceptive Factor to Drug-Induced Cholestatic Injury.Mol Pharm. 2016 Apr 4;13(4):1206-16. doi: 10.1021/acs.molpharmaceut.5b00659. Epub 2016 Mar 8. Mol Pharm. 2016. PMID: 26910619
-
The endothelin antagonist bosentan inhibits the canalicular bile salt export pump: a potential mechanism for hepatic adverse reactions.Clin Pharmacol Ther. 2001 Apr;69(4):223-31. doi: 10.1067/mcp.2001.114667. Clin Pharmacol Ther. 2001. PMID: 11309550
-
Picroside II protects against cholestatic liver injury possibly through activation of farnesoid X receptor.Phytomedicine. 2020 Mar;68:153153. doi: 10.1016/j.phymed.2019.153153. Epub 2019 Dec 16. Phytomedicine. 2020. PMID: 32018210
-
Bile salt excretory pump: biology and pathobiology.J Pediatr Gastroenterol Nutr. 2006 Jul;43 Suppl 1:S10-6. doi: 10.1097/01.mpg.0000226385.71859.5f. J Pediatr Gastroenterol Nutr. 2006. PMID: 16819395 Review.
-
The protective role of hydrophilic tetrahydroxylated bile acids (THBA).Biochim Biophys Acta Mol Cell Biol Lipids. 2021 Jul;1866(7):158925. doi: 10.1016/j.bbalip.2021.158925. Epub 2021 Mar 11. Biochim Biophys Acta Mol Cell Biol Lipids. 2021. PMID: 33713832 Review.
Cited by
-
The assessment of the potential hepatotoxicity of new drugs by in vitro metabolomics.Front Pharmacol. 2023 May 5;14:1155271. doi: 10.3389/fphar.2023.1155271. eCollection 2023. Front Pharmacol. 2023. PMID: 37214440 Free PMC article. Review.
-
Dataset on transcriptomic profiling of cholestatic liver injury in an in vitro and in vivo animal model.Data Brief. 2020 Aug 7;32:106156. doi: 10.1016/j.dib.2020.106156. eCollection 2020 Oct. Data Brief. 2020. PMID: 32904329 Free PMC article.
-
Metabolic Biomarkers of Liver Failure in Cell Models and Patient Sera: Toward Liver Damage Evaluation In Vitro.Int J Mol Sci. 2024 Dec 23;25(24):13739. doi: 10.3390/ijms252413739. Int J Mol Sci. 2024. PMID: 39769500 Free PMC article.
-
Tight junction stabilization prevents HepaRG cell death in drug-induced intrahepatic cholestasis.Biol Open. 2021 Jun 1;10(6):bio058606. doi: 10.1242/bio.058606. Epub 2021 Jun 21. Biol Open. 2021. PMID: 34151938 Free PMC article.
-
Metabolomics-based strategy to assess drug hepatotoxicity and uncover the mechanisms of hepatotoxicity involved.Arch Toxicol. 2023 Jun;97(6):1723-1738. doi: 10.1007/s00204-023-03474-8. Epub 2023 Apr 6. Arch Toxicol. 2023. PMID: 37022445 Free PMC article.
References
-
- Alvarez L, Jara P, Sánchez-Sabaté E, Hierro L, Larrauri J, Díaz MC, Camarena C, De la Vega A, Frauca E, López-Collazo E, Lapunzina P. Reduced hepatic expression of farnesoid X receptor in hereditary cholestasis associated to mutation in ATP8B1. Hum Mol Genet. 2004;13:2451–2460. - PubMed
-
- Begriche K, Massart J, Robin MA, Borgne-Sanchez A, Fromenty B. Drug-induced toxicity on mitochondria and lipid metabolism: mechanistic diversity and deleterious consequences for the liver. J Hepatol. 2011;54:773–794. - PubMed
-
- Beuers U, Trauner M, Jansen P, Poupon R. New paradigms in the treatment of hepatic cholestasis: from UDCA to FXR, PXR and beyond. J Hepatol. 2015;62:S25–S37. - PubMed
-
- Bremer J. Carnitine-metabolism and functions. Physiol Rev. 1983;63:1420–1480. - PubMed
MeSH terms
Substances
Grants and funding
LinkOut - more resources
Full Text Sources
Other Literature Sources
