. 2018:1757:69-113.
doi: 10.1007/978-1-4939-7737-6_5.

EuPathDB: The Eukaryotic Pathogen Genomics Database Resource

Affiliations

EuPathDB: The Eukaryotic Pathogen Genomics Database Resource

Susanne Warrenfeltz et al. Methods Mol Biol. 2018.

Abstract

Fighting infections and developing novel drugs and vaccines requires advanced knowledge of pathogen's biology. Readily accessible genomic, functional genomic, and population data aids biological and translational discovery. The Eukaryotic Pathogen Database Resources ( http://eupathdb.org ) are data mining resources that support hypothesis driven research by facilitating the discovery of meaningful biological relationships from large volumes of data. The resource encompasses 13 sites that support over 170 species including pathogenic protists, oomycetes, and fungi as well as evolutionarily related nonpathogenic species. EuPathDB integrates preanalyzed data with advanced search capabilities, data visualization, analysis tools and a comprehensive record system in a graphical interface that does not require prior computational skills. This chapter describes guiding concepts common across EuPathDB sites and illustrates the powerful data mining capabilities of some of the available tools and features.

Keywords: Bioinformatics; Fungi; Genomics; Orthology; Parasite; Pathogen; Proteomics; Sequence analysis; Transcriptomics.


Figures

Figure 1
Figure 1. EuPathDB home page and its main features.
A. The interactive header is visible from any EuPathDB page. The tabs and dropdown menus in the gray menu bar provide access to all EuPathDB searches and tools. B. The component site link outs section provides direct links to the taxon-specific sites. C. The core section consisting of three panels: ‘Search for Genes’, ‘Search for Other Data Types’ and ‘Tools’. D. The side bar contains useful links and information including news releases, community resources and a summary of integrated data. E. Find a Search Tool. This text search finds available searches within the Search for Genes bubble.
Figure 2
Figure 2. Result of a text search in EuPathDB.
Search results are presented in the My Strategies section and consist of three parts. A. The Strategy panel provides a graphic representation of the search or strategy result. The search result highlighted in yellow is the ’active’ result and further displayed in the Filter tables (B) and the Gene Result (C). B. The Component site and organism filter tables shows the distribution of hits from the result across the taxon-specific sites and the organisms queried, respectively. C. The Result tables currently showing the Gene Result tab which lists all hits for the active search result. The first column, Gene ID, is a link to the record page for that gene.
Figure 3
Figure 3. Gene record page: Main sections.
A. Record pages include an overview section at the top, with basic information including gene ID, product description or genome location. B. Shortcuts are available on the right side of the overview, and provide quick navigation links, but also quick views of the images that appear in the data section of the gene record. C. The data section is displayed below the overview. Organized in consistent, site-wide categories, the data section contains all available information about the gene. D. The searchable, and collapsible ‘Contents’ menu gives easy access to all the data sections (C). The contents section will remain visible while scrolling the record page and clicking on the double arrow icon will collapse the menu, giving full screen width to the record entry.
Figure 4
Figure 4. Gene record page: Shortcuts.
A. Shortcuts can be found at the top of the gene page, on the right side of the overview section. Clicking on the magnifying glass icon (blue circle), will open a graphical display summarizing the data. Clicking on a shortcut image, or on the title above it (blue oval), navigates to the corresponding section of the record page (B).
Figure 5
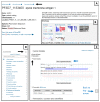
Figure 5. Gene record page: The ‘Download Gene’ link.
Information available in the gene record, including sequences, can be easily exported using the ‘Download gene’ link, located at the top of the overview section. Users can create their own tables choosing gene attributes of interest.
Figure 6
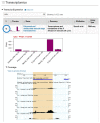
Figure 6. Transcriptomics table.
Transcript expression datasets are organized in searchable data tables, with expandable rows that reveal detailed data. Each dataset includes expression data in tabular and graphical format, as well as coverage plots for RNA sequence data sets.
Figure 7
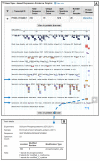
Figure 7. Proteomics data on gene page.
A. The Mass Spec.-based Expression table displays peptides mapped to the gene’s protein product. B. Hover over the glyphs to reveal details concerning the mapped peptides.
Figure 8
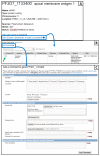
Figure 8. Submitting user comments.
A. Summary section of PF3D7_1133400 gene record page showing “add a comment” link. B. User Comments table listing comments and associated information. C. Form for adding a comment to a gene.
Figure 9
Figure 9. Orthology and Synteny data on gene pages.
A. Header section of TriTrypDB. Enter the gene ID, Tb927.1.4540 to reach the gene page. B. Contents navigation panel with section 7 chosen will direct the data section to the Orthology and Synteny section. C. The gene page Synteny graph showing tracks for T. brucei TREU927 and T. brucei Lister 427. D. Hovering over the glyphs in the Synteny graph reveals details concerning the gene.
Figure 10
Figure 10. Metabolic Pathways represented in TriTrypDB.
A. The Search for Other Data Types panel with the Metabolic Pathways category open to reveal the types of searches that return Metabolic Pathway records. B. The Pathway Name ID search page depicting the ‘typeahead’ function for entering pathway names in the Pathway Name/IC parameter. C. Partial view of the Glycolycic 1 pathway showing the zoom function (1) product, an enzyme node (2) and a compound node (3). D. Node details popup that appears when an enzyme or compound node is clicked. E. Enzyme node painted with expression graph from integrated experimental data.
Figure 11
Figure 11. Creating strategies by combining search results.
A. PlasmoDB Strategy returning a list of 74 genes that are likely P. vivax proteases and expressed in gametocytes. The strategy is also available here: http://plasmodb.org/plasmo/im.do?s=2db873c2b03b57bf. Creating this strategy in the current database may produce a different result since genome annotations may be updated with new database releases. B. Table showing the 5 options for combining searches into a strategy. When two searches are combined, the two result sets (list of IDs) are merged according to the operator that you specify. If the searches return the same type of genomic feature they can be combined using any of the 5 operators (i.e. search 1 returns genes, search 2 returns genes). However, searches that return different genomic features (i.e. search 1 returns genes, search 2 returns SNPs) will yield no results when combined with intersect, union or minus operators because there are no IDs in the list of genes (search 1 result) that are present in the list of SNPs (search 2 results). To combine a search that returns genes with a search that returns SNPs, you must use the collocation option (1 relative to 2) to find, for example, genes with SNPs in their upstream regions.
Figure 12
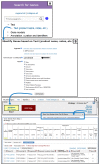
Figure 12. Text search in PlasmoDB that finds genes that are likely proteases.
A. Home page panel showing access to the Text search page. B. The Text search page with protease entered for the Text Term parameter. Clicking Get Answer will initiate a search for genes whose records contain the word ‘protease’ in all the Fields chosen. C. The results of the search as displayed in the ‘My Strategies’ section. The search returned over 1600 genes that are likely proteases.
Figure 13
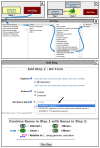
Figure 13. Creating Step 2 of the Strategy (Example 1).
A. The Add Step button for initiating subsequent strategy steps. B. The Add Step popup for choosing searches the next search in the strategy. All searches are available from this popup. C. The GO Term search depicting the choice of GO Terms using the ‘GO Term or GO ID’ parameter type ahead. D. The strategy result after running the second search in the strategy – the GO Term search.
Figure 14
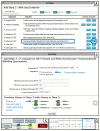
Figure 14. Creating Step 3 of the PlasmoDB strategy.
A. The Add step popup showing the available searches against RNA sequencing data sets. B. The search form for the chosen gametocyte RNA sequencing data set. C. The strategy results after adding Step 3. D. The filter table for Step 3 results. Only P. falciparum genes are returned in step three because the RNA sequencing experiment was performed with P. falciparum parasites.
Figure 15
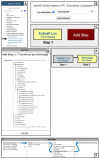
Figure 15. Transform by Orthology tool.
A. The Add Step popup for accessing the tool. B. The transform by Orthology tool configured to transform to P. vivax Sal1. C. The final four step strategy returning 74 P. vivax genes that likely have protease activity and expressed in gametocytes.
Figure 16
Figure 16. Find T gondii and N caninum genes that are predicted to be localized to the apicoplast.
A. The EuPathDB Search for Genes panel with the Protein targeting and localization category opened. The P.f. Subcellular Localization search is accessible here. B. The P.f. Subcellular Localization search page containing only one parameter. C. The strategy panel showing the result of Step 1. D. The Transform by Orthology tool arranged to transform genes from the previous step into T. gondii ME49, T. gondii GT1and N. caninum Liverpool. E. The strategy panel after the transformation. F. The Add Step panel configured to access the Orthology Phylogenetic Profile search.
Figure 17
Figure 17. The Orthology Phylogenetic Profile search
A. Parameter for defining the orthology-based phylogenetic profile of the genes returned by the search. The phylogenetic profile of a gene is a series of "present" or "absent" calls, reflecting the inclusion of a gene in ortholog groups determined by the OrthoMCL algorithm. As shown, the parameter is configured to return genes that do not have orthologs in Cryptosporidium or Mammalia. B. A three-step strategy that returns a refined set of T. gondii ME49, T. gondii GT1 and N. canninum Liv genes that are likely targeted to the apicoplast. The completed strategy is available here: http://eupathdb.org/eupathdb/im.do?s=3353bf3401d62d48
Figure 18
Figure 18. The Genome Browser main features.
A. The ‘View in genome browser’ link from all gene pages, open the browser in the region of the gene. B. The browser’s main features: the landmark region (1), the Overview, Region and Details scales (2), track controls (3), zoom and scrolling controls. C. The Select Tracks tab for choosing tracks to display in the browser.
Figure 19
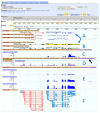
Figure 19. The Genome Browser for data visualization and mining.
A. TGME49 genome in the region of the HXGPRT gene as displayed in the Genome Browser. Data tracks showing the current gene model and supporting splice junctions (introns) determined from RNA sequencing data. B. Tracks created from CRAIG gene prediction analysis output. These tracks show an alternative to the official gene model. C. RNA Sequencing reads from a single tachyzoite sample aligned to the genome. D. RNA sequencing reads aligned to the genome and displayed with three subtracks overlaid for easy viewing. E. Three subtracks representing time points of an RNA sequencing experiment measuring transcriptomes of cat enteroepithelial stages. F. Expressed sequence tag alignments.
Figure 20
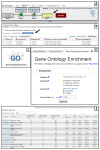
Figure 20. The Result Analysis Tool.
A. PlasmoDB strategy focuses on Step 4. Use this URL to access the strategy http://plasmodb.org/plasmo/im.do?s=2db873c2b03b57bf. B. The strategy’s gene result showing the Analyze Results button. C. The Gene Ontology Enrichment tool button. D. The Gene Ontology Enrichment tool showing parameters E. Results of a GO enrichment analysis, displaying enriched GO IDs and associated data.
Figure 21
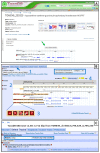
Figure 21. EuPathDB Galaxy access and main features.
A. Shown in FungiDB. The Galaxy instance can be accessed via the Analyze My Experiment tab, which is conveniently located within the main menu (in grey). B. From left to right. The workspace has four major components: the left panel (1) lists available large-scale data analysis tools, the center panel (2) which is the main interactive interface and also contains pre-configured workflows for the RNA-seq analysis, and the job history (3) panel on the right. The main panel is controlled via the Galaxy menu at the top. C. BigWig file displaying RNA-seq peaks for a gene in the filamentous fungus Aspergillus nidulans. Files are automatically directed to FungiDB via Display in FungiDB GBrowse links available in the job history panel.
Figure 22
Figure 22. File Transfer to Galaxy and Workflows.
A. To upload raw read files to Galaxy, the Paste/Fetch data button can be used to specify ftp addresses of the raw reads files at EBI. Genomes can be selected from the Genome drop-down menu. B. Create workflows in the EuPathDB Galaxy workspace. A portion of the sample RNA-seq workflow is shown. This workflow can be modified and saved for later use.

References

    1. Aurrecoechea C, Barreto A, Basenko EY, Brestelli J, Brunk BP, Cade S, Crouch K, Doherty R, Falke D, Fischer S, Gajria B, et al. EuPathDB: the eukaryotic pathogen genomics database resource. Nucleic Acids Res. 2017;45(D1):D581–D591. doi: 10.1093/nar/gkw1105. - DOI - PMC - PubMed
    1. Aurrecoechea C, Barreto A, Brestelli J, Brunk BP, Cade S, Doherty R, Fischer S, Gajria B, Gao X, Gingle A, Grant G, et al. EuPathDB: the eukaryotic pathogen database. Nucleic Acids Res. 2013;41(Database issue):D684–691. doi: 10.1093/nar/gks1113. - DOI - PMC - PubMed
    1. Stein LD, Mungall C, Shu S, Caudy M, Mangone M, Day A, Nickerson E, Stajich JE, Harris TW, Arva A, Lewis S. The generic genome browser: a building block for a model organism system database. Genome Res. 2002;12(10):1599–1610. - PMC - PubMed
    1. Steinbiss S, Silva-Franco F, Brunk B, Foth B, Hertz-Fowler C, Berriman M, Otto TD. Companion: a web server for annotation and analysis of parasite genomes. Nucleic Acids Res. 2016;44(W1):W29–34. doi: 10.1093/nar/gkw292. - DOI - PMC - PubMed
    1. Peng D, Tarleton R. EuPaGDT: a web tool tailored to design CRISPR guide RNAs for eukaryotic pathogens. Microb Genom. 2015;1(4):e000033. doi: 10.1099/mgen.0.000033. - DOI - PMC - PubMed

Publication types

LinkOut - more resources