. 2019 Jan 1;527(1):212-224.
doi: 10.1002/cne.24467. Epub 2018 Aug 22.

Distinct timing of neurogenesis of ipsilateral and contralateral retinal ganglion cells

Affiliations

Distinct timing of neurogenesis of ipsilateral and contralateral retinal ganglion cells

Florencia Marcucci et al. J Comp Neurol. .

Abstract

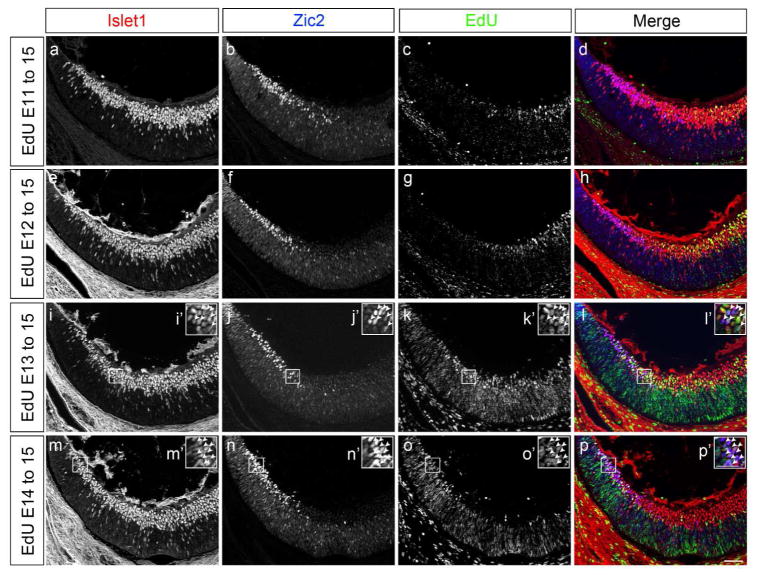
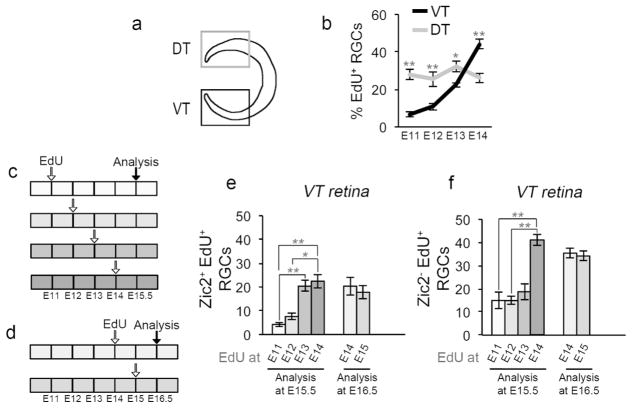
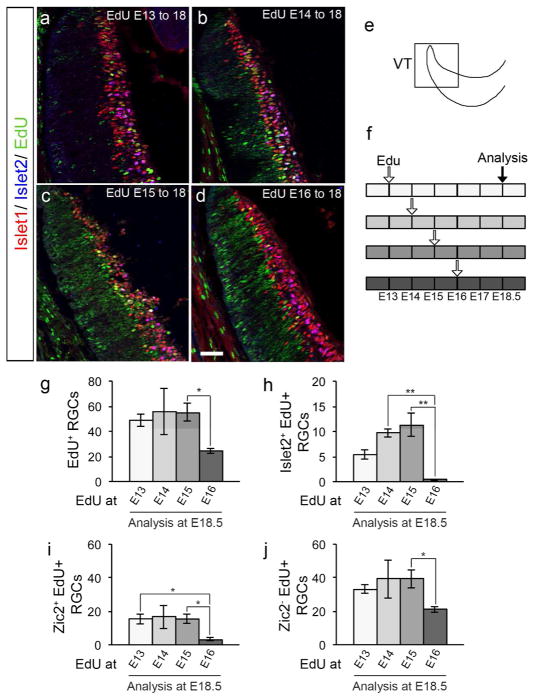
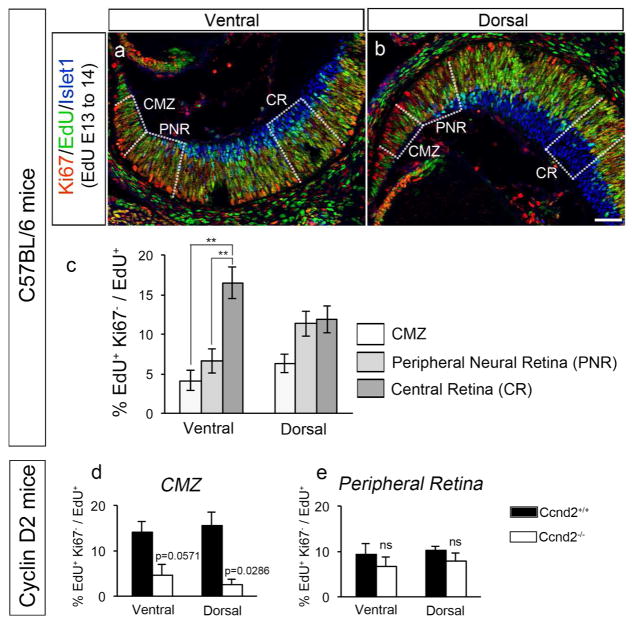
In higher vertebrates, the circuit formed by retinal ganglion cells (RGCs) projecting ipsilaterally (iRGCs) or contralaterally (cRGCs) to the brain permits binocular vision and depth perception. iRGCs and cRGCs differ in their position within the retina and in expression of transcription, guidance and activity-related factors. To parse whether these two populations also differ in the timing of their genesis, a feature of distinct neural subtypes and associated projections, we used newer birthdating methods and cell subtype specific markers to determine birthdate and cell cycle exit more precisely than previously. In the ventrotemporal (VT) retina, i- and cRGCs intermingle and neurogenesis in this zone lags behind RGC production in the rest of the retina where only cRGCs are positioned. In addition, within the VT retina, i- and cRGC populations are born at distinct times: neurogenesis of iRGCs surges at E13, and cRGCs arise as early as E14, not later in embryogenesis as reported. Moreover, in the ventral ciliary margin zone (CMZ), which contains progenitors that give rise to some iRGCs in ventral neural retina (Marcucci et al., 2016), cell cycle exit is slower than in other retinal regions in which progenitors give rise only to cRGCs. Further, when the cell cycle regulator Cyclin D2 is missing, cell cycle length in the CMZ is further reduced, mirroring the reduction of both i- and cRGCs in the Cyclin D2 mutant. These results strengthen the view that differential regulation of cell cycle dynamics at the progenitor level is associated with specific RGC fates and laterality of axonal projection.

Keywords: RRID: AB_2315623; RRID: AB_2534079; RRID: AB_2535812; RRID: AB_2556549; RRID: AB_443209; RRID: AB_528173; binocular vision; contralateral RGCs; ipsilateral RGCs; neurogenesis; retina.


Conflict of interest statement

Conflict of Interest: The authors declare no competing financial interests.

Figures

Figure 1
Figure 1. Neurogenesis in ventrotemporal retina increases after E13
a to p: Frontal sections through ventrotemporal (VT) retina of C57BL/6 mice injected with EdU at E11, 12, 13 or 14, and analyzed at E15.5 with specific retinal ganglion cell (RGC) markers (see Figure 2a and c for schemes of a retinal frontal section, and EdU timeline, respectively). Frontal retinal sections were immunostained with antibodies against Islet1 (postmitotic RGCs) and Zic2 (ipsilateral RGCs), and processed for EdU detection. Panels a to d, e to h, i to l, and m to p correspond to the same frontal section. a, e, i, m: Channel corresponding to Islet1 immunostaining. Insets i′ and m′ are magnified panels of boxed retinal areas in panels i and m respectively. b, f, j, n: Channel corresponding to Zic2 immunostaining. Zic2+ RGCs are situated at the most peripheral zone of VT retina. Insets j′ and n′ are magnified panels of boxed retinal areas in panels j and n, respectively. c, g, k, o: Channel corresponding to EdU detection. Note that prolonging the time interval between EdU injection and analysis results in reduced EdU signal. This is due to increased rounds of progenitor cell division and subsequent dilution of the EdU compound (see Materials and Methods section for further details on EdU detection and analysis). Insets k′ and o′ are magnified panels of boxed retinal areas in panels k and o respectively. d, h, l, p: Merge channels. Colors are as follows: Islet1 in red, Zic2 in blue, and EdU in green. Insets l′ and p′ are magnified panels of boxed retinal areas in panels l and p, respectively. Arrows highlight Zic2+Islet1+ labeled RGCs with EdU at E13 and E14. Very few Zic2+Islet1+ RGCs are labeled with EdU when EdU is injected at E11 and E12. E, embryonic day. Scale bar in p, 50 μm, applies to panels a to p. Scale bar in p′ 25μm applies to insets i′ to p′.
Figure 2
Figure 2. Ipsilateral and contralateral RGC are generated at distinct embryonic times
a: Cartoon depicting ventrotemporal (VT) and dorsotemporal (DT) regions of retina. Zic2+ ipsilateral RGCs (iRGCs) reside in VT retina exclusively, whereas Zic2 contralateral RGCs (cRGCs) localize to the entire retina, with DT retina comprised of cRGCs only. Islet1 labels all postmitotic RGCs throughout the retina. b: Quantification of RGC genesis from E11 to E14, in VT and DT retina. EdU was injected into pregnant dams at E11, 12, 13, or 14 as in Figure 1 (see also Figure 2c). Frontal retinal sections were immunostained with antibodies to Islet1 and processed for EdU detection at E15.5. Coincidence of Islet1 and EdU signal indicates that an RGC was born at the time of the EdU injection. RGC production was calculated as the percentage of Islet1+EdU+ double-labeled RGCs, divided by the total number of Islet1+ RGCs. Whereas the production of RGCs in DT retina is constant from E11 to E14, RGC genesis in VT retina is low at E11–12 and increases at E13. n for VT: n=6 at E11, 9 at E12, 6 at E13, and 7 at E14. n for DT: n=6 for E11, 4 for E12, 6 for E13, and 4 for E14. c: Timeline of 5-ethynyl-2′-deoxyuridine (EdU) injections at E11, 12, 13, or 14, and sacrifice at E15.5. Each box represents 12 hours, and each empty arrow represents three injections of EdU (10 am, 2 pm, 6 pm). The black arrow represents the time of analysis. d: Timeline of EdU injections at E14 or 15 and sacrifice at E16.5. Each box represents 12 hours, and each empty arrow represents three injections of EdU (10 am, 2 pm, 6 pm). The black arrow represents the time of analysis. e: Bar graph comparing the number of ipsilateral Zic2+ RGCs labeled with EdU (identified as Zic2+/Islet1+/EdU+ triple-labeled cells) in VT retina in mice injected with EdU at E11, 12, 13 or 14 and analyzed at E15.5 (left bars), or injected with EdU at E14 or 15 and analyzed at E16.5 (right bars). Ipsilateral RGC neurogenesis in VT retina increases at E13, and remains constant throughout E15. n for EdU until E15.5: n=6 at E11, 9 at E12, 6 at E13, and 7 at E14. n for EdU until E16.5: n=6 at E14, and 4 at E15. f: Bar graph comparing the number of Zic2 (contralateral) RGCs labeled with EdU (identified as Zic2/Islet1+/EdU+ triple-labeled cells) in VT retina in mice injected with EdU at E11, 12, 13 or 14 and analyzed at E15.5 (left bars), or injected with EdU at E14 or 15 and analyzed at E16.5 (right bars). Contralateral RGC neurogenesis in VT retina increases at E14, one day after the surge in iRGC production, and remains constant until at least E15.5. Of note, the majority of Zic2 cRGCs labeled with EdU at E14.5 do not express Zic2 at E15.5 (left bars) or at E16.5 (right bars), suggesting that these RGCs do not upregulate the ipsilateral marker Zic2 and are in all likelihood contralateral. n for EdU until E15.5: n=6 at E11, 9 at E12, 6 at E13, and 7 at E14. n for EdU until E16.5: n=6 at E14, and 4 at E15. For pairwise comparisons, * when p<0.05, and ** when p<0.01. For details on the statistical analysis, please see Table 2.
Figure 3
Figure 3. Contralateral Islet2+ RGCs from ventrotemporal retina are generated before E16, earlier than previously thought
a to d: Frontal sections through ventrotemporal (VT) retina of C57BL/6 mice injected with EdU at E13 (a), 14 (b), 15 (c) or 16 (d), and analyzed at E18.5 with specific retinal ganglion cell (RGC) markers. Frontal retinal sections were immunostained with antibodies against Islet1 (postmitotic RGCs, in red) and Islet2 (contralateral RGCs, in blue), and processed for EdU detection (in green). Scale bar in d, 50 μm, applies to all panels. e: Scheme of the VT zone of the retina in a frontal section. f: Timeline of EdU injections at E13, 14, 15 or 16 and sacrifice at E18.5. Each box represents 12 hours, and each empty arrow represents three injections of EdU (10 am, 2 pm, 6 pm). The black arrow represents the time of analysis. g: Bar graph comparing the number of RGCs labeled with EdU (Islet1+/EdU+ double-positive cells) in VT retina of mice injected with EdU at E13, 14, 15 or 16 and analyzed at E18.5. There is a significant decrease of RGC neurogenesis at E16, suggesting that the RGCs that comprise the VT retina at E18.5 are born before E16. n=8 for E13, 3 for E14, 8 for E15, and 7 for E16. h: Bar graph comparing the amount of contralateral Islet2+ RGCs labeled with EdU (Islet1+/Islet2+/EdU+ triple-positive cells) in VT retina of mice injected with EdU at E13, 14, 15 or 16 and analyzed at E18.5. There is a significant decrease of contralateral Islet2+ RGC neurogenesis at E16, suggesting that this subtype of contralateral RGCs found in VT retina after E17-E18 emerges before E16. n=8 for E13, 5 for E14, 8 for E15, and 6 for E16. i: Bar graph comparing the number of ipsilateral Zic2+ RGCs labeled with EdU (Islet1+/Zic2+/EdU+ triple-positive cells) in VT retina of mice injected with EdU at E13, 14, 15 or 16 and analyzed at E18.5. There is a significant reduction in ipsilateral Zic2+ RGC neurogenesis at E16, suggesting that ipsilateral RGCs are generated until E16. n=8 for E13, 3 for E14, 8 for E15, and 7 for E16. j: Bar graph comparing the number of contralateral Zic2 RGCs labeled with EdU (Islet1+/Zic2/EdU+ double-positive cells) in VT retina of mice injected with EdU at E13, 14, 15 or 16 and analyzed at E18.5. There is a significant decrease in contralateral Zic2 RGC neurogenesis at E16, suggesting that contralateral RGCs are generated in VT retina until E16. Of note, we expect that a population of Zic2 RGCs expresses the contralateral marker Islet2. n=8 for E13, 3 for E14, 8 for E15, and 7 for E16. For pairwise comparisons, * when p<0.05, and ** when p<0.01. For details on the statistical analysis, please see Table 2.
Figure 4
Figure 4. Fewer cells exit the cell cycle in the CMZ and peripheral ventral retina, and this process in the CMZ is Cyclin D2-dependent
a and b: Frontal sections through ventral (panel a) and dorsal (panel b) retina of C57BL/6 mice injected with EdU at E13 and analyzed at E14.5 with specific markers. Frontal retinal sections were immunostained with antibodies against Ki67 (cells in the cell cycle, in red) and Islet1 (postmitotic RGCs, in blue) and, processed for EdU detection (in green). The three zones in which quantifications were performed for the bar graph in panel c are delineated by dashed lines: Ciliary Margin Zone (CMZ), Peripheral Neural Retina (PNR), and Central Retina (CR). Scale bar in b, 50 μm, applies to both panels. c: Bar graph comparing the rate of cell cycle exit in the three retinal zones delineated in panels a and b for ventral and dorsal retina of C57BL/6 mice. Cell cycle exit was calculated as the ratio of the number of EdU+ cells that did not express the proliferation marker Ki67 (EdU+Ki67) divided by total EdU+ cells (see Materials and Methods section for further details). Fewer cells exit the cell cycle in the CMZ and ventral peripheral neural retina (PNR) zone, where both i- and cRGCs reside, compared with the dorsal PNR. n= 6 for CMZ, 6 for PNR and 6 for CR. d and e: Bar graphs comparing the rate of cell cycle exit in ventral and dorsal retina of Cyclin D2 mutant mice and wild type littermates injected with EdU at E13 and analyzed at E14.5 with specific markers. As in panels a to c, retinal sections were immunostained with antibodies against Ki67 (cells undergoing cell cycle, in red) and Islet1 (postmitotic RGCs, in blue) and processed for EdU detection (in green). Cell cycle exit was calculated as the ratio between EdU+ cells that did not express the proliferation marker Ki67 (EdU+Ki67) divided by total EdU+ cells in the CMZ (panel d) and Peripheral Neural Retina (panel e) zones. The cell cycle regulator Cyclin D2 is expressed in both dorsal and ventral CMZ, and is particularly enriched in ventral CMZ. Nonetheless, fewer cells exit cell cycle in both ventral and dorsal CMZ in the absence of Cyclin D2. In contrast, cell cycle exit is not affected in Cyclin D2−/− peripheral neural retina, a zone of the retina that does not express Cyclin D2. n=4 for Ccnd2+/+ and 4 for Ccnd2−/−. For pairwise comparisons, ** when p<0.01. For details on the statistical analysis, please see Table 2.

Similar articles

Cited by

References

    1. Agathocleous M, Locker M, Harris WA, Perron M. A general role of hedgehog in the regulation of proliferation. Cell Cycle. 2007;6(2):156–159. 3745 [pii] - PubMed
    1. Alexiades MR, Cepko C. Quantitative analysis of proliferation and cell cycle length during development of the rat retina. Dev Dyn. 1996;205(3):293–307. doi: 10.1002/(SICI)1097-0177(199603)205:3<293::AID-AJA9>3.0.CO;2-D. [pii] - DOI - PubMed
    1. Bassett EA, Wallace VA. Cell fate determination in the vertebrate retina. Trends Neurosci. 2012;35(9):565–573. doi: 10.1016/j.tins.2012.05.004. S0166-2236(12)00087-2 [pii] - DOI - PubMed
    1. Batista-Brito R, Close J, Machold R, Fishell G. The distinct temporal origins of olfactory bulb interneuron subtypes. J Neurosci. 2008;28(15):3966– 3975. doi: 10.1523/JNEUROSCI.5625-07.2008. 28/15/3966 [pii] - DOI - PMC - PubMed
    1. Bhansali P, Rayport I, Rebsam A, Mason C. Delayed neurogenesis leads to altered specification of ventrotemporal retinal ganglion cells in albino mice. Neural Dev. 2014;9:11. doi: 10.1186/1749-8104-9-11. - DOI - PMC - PubMed

Publication types

LinkOut - more resources