

Rapid Two-Millisecond Interrogation of Electrochemical, Aptamer-Based Sensor Response Using Intermittent Pulse Amperometry
- PMID: 29762016
- PMCID: PMC6207073
- DOI: 10.1021/acssensors.8b00278
Rapid Two-Millisecond Interrogation of Electrochemical, Aptamer-Based Sensor Response Using Intermittent Pulse Amperometry
Abstract
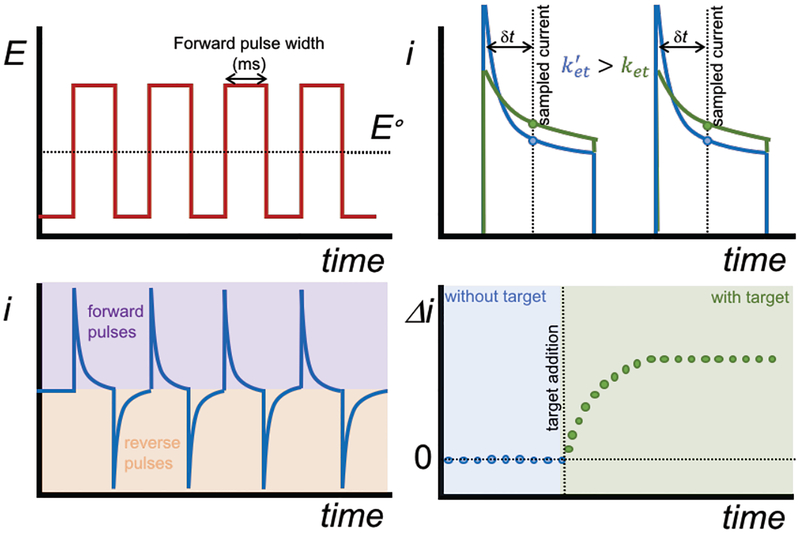
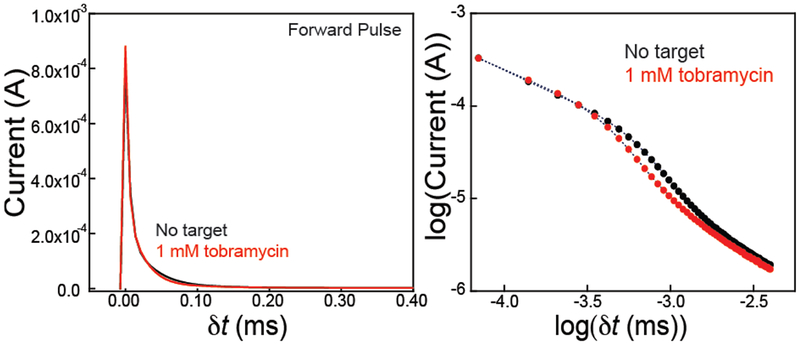
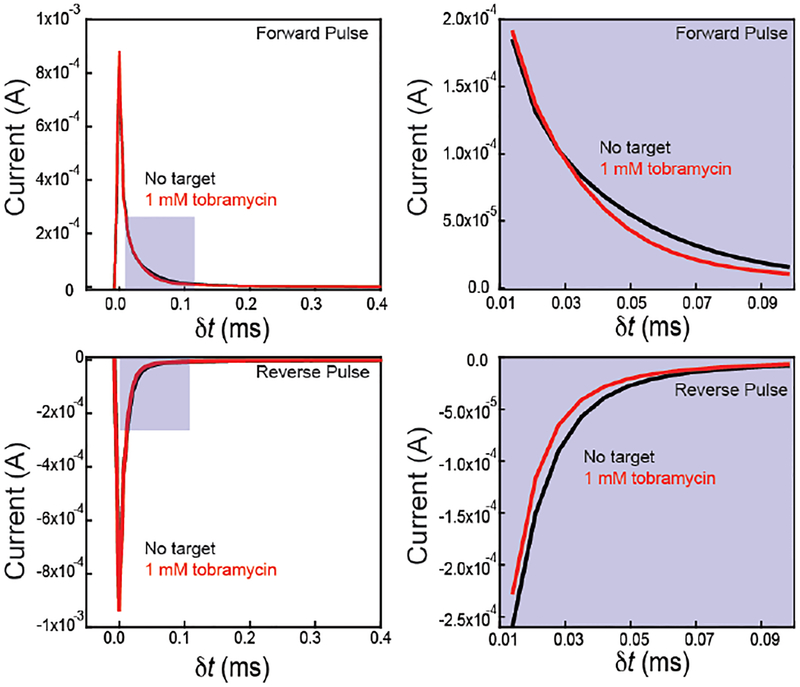
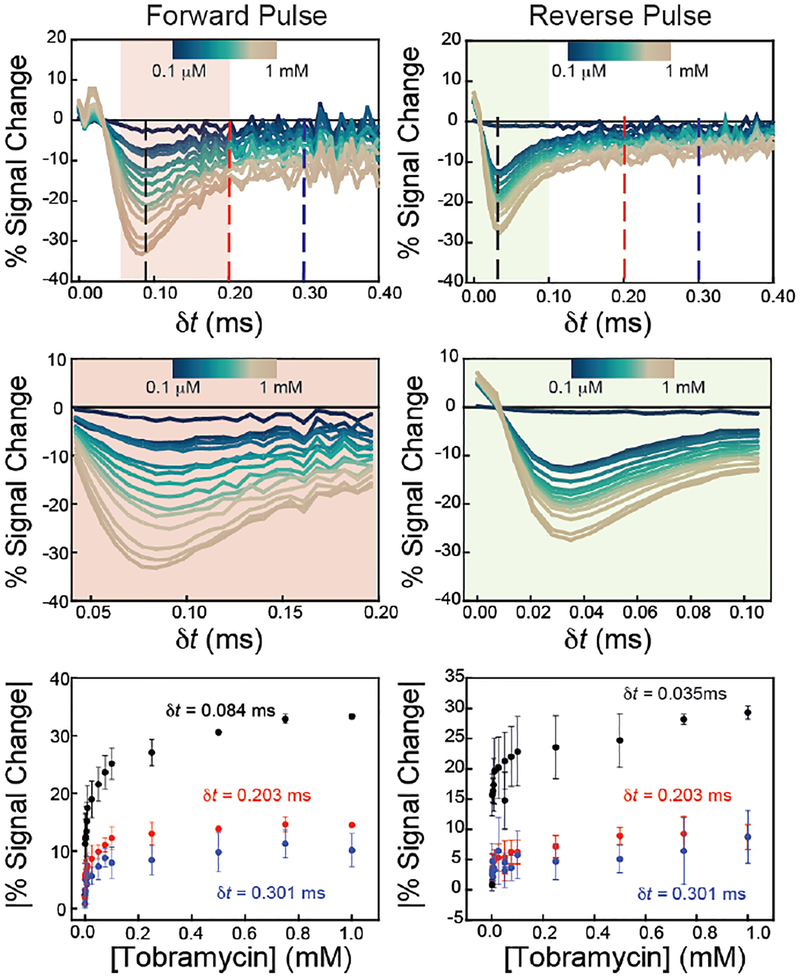
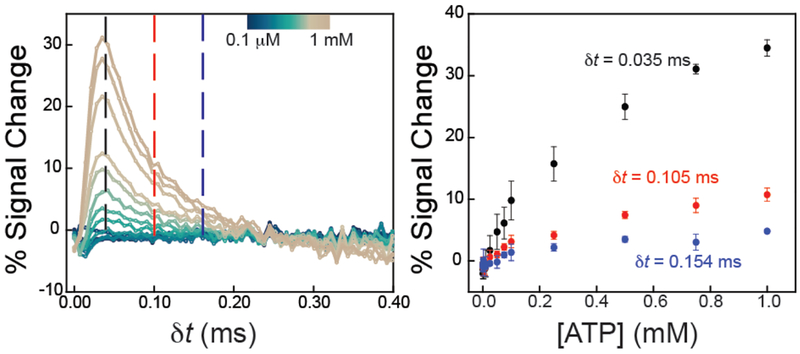
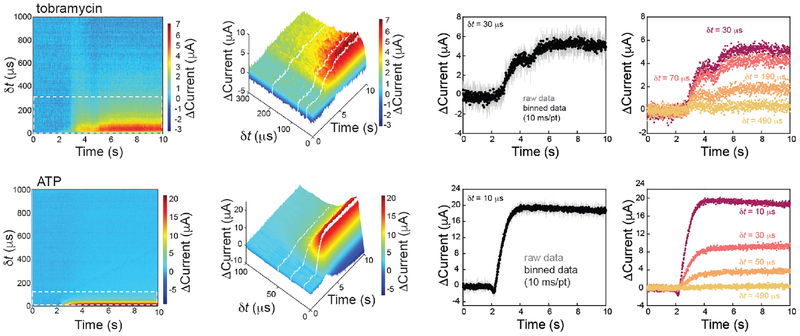
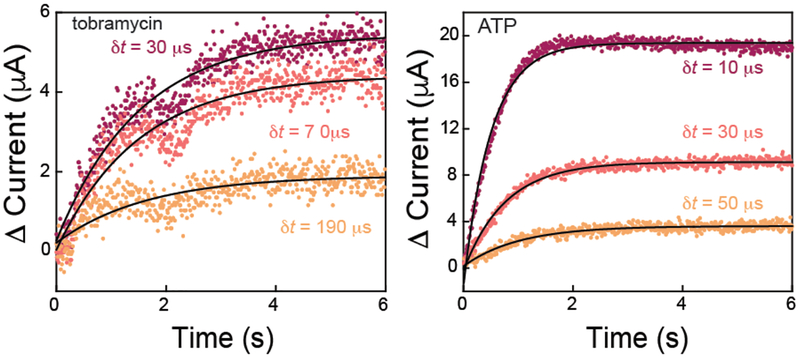
In this manuscript, we employ the technique intermittent pulse amperometry (IPA) to interrogate equilibrium and kinetic target binding to the surface of electrochemical, aptamer-based (E-AB) sensors, achieving as fast as 2 ms time resolution. E-AB sensors comprise an electrode surface modified with a flexible nucleic acid aptamer tethered at the 3'-terminus with a redox-active molecule. The introduction of a target changes the conformation and flexibility of the nucleic acid, which alters the charge transfer rate of the appended redox molecule. Typically, changes in charge transfer rate within this class of sensor are monitored via voltammetric methods. Here, we demonstrate that the use of IPA enables the detection of changes in charge transfer rates (i.e., current) at times <100 μs after the application of a potential pulse. Changes in sensor current are quantitatively related to target analyte concentration and can be used to create binding isotherms. Furthermore, the application of IPA enables rapid probing of the electrochemical surface with a time resolution equivalent to as low as twice the applied potential pulse width, not previously demonstrated with traditional voltammetric techniques employed with E-AB sensors (alternating current, square wave, cyclic). To visualize binding, we developed false-color plots analogous to those used in the field of fast-scan cyclic voltammetry. The use of IPA is universal, as demonstrated with two representative small molecule E-AB sensors directed against the aminoglycoside antibiotic tobramycin and adenosine triphosphate (ATP). Intermittent pulse amperometry exhibits an unprecedented sub-microsecond temporal response and is a general method for measuring rapid sensor performance.
Keywords: aptamers; binding kinetics; electrochemistry; intermittent pulse amperometry; sensors.
Figures

Similar articles
-
Real-Time, In Vivo Molecular Monitoring Using Electrochemical Aptamer Based Sensors: Opportunities and Challenges.ACS Sens. 2022 Oct 28;7(10):2823-2832. doi: 10.1021/acssensors.2c01428. Epub 2022 Oct 7. ACS Sens. 2022. PMID: 36205360 Free PMC article. Review.
-
Microscale, Electrochemical, Aptamer-Based Sensors for Enhanced Small-Molecule Detection at Millisecond Time Scales.ACS Sens. 2023 Dec 22;8(12):4521-4530. doi: 10.1021/acssensors.3c01055. Epub 2023 Nov 21. ACS Sens. 2023. PMID: 38104257 Free PMC article.
-
Heterogeneous Electrochemical Aptamer-Based Sensor Surfaces for Controlled Sensor Response.Langmuir. 2015 Jun 16;31(23):6563-9. doi: 10.1021/acs.langmuir.5b01418. Epub 2015 Jun 2. Langmuir. 2015. PMID: 26005758 Free PMC article.
-
Electrochromic, Closed-Bipolar Electrodes Employing Aptamer-Based Recognition for Direct Colorimetric Sensing Visualization.Anal Chem. 2019 Sep 3;91(17):11467-11473. doi: 10.1021/acs.analchem.9b03013. Epub 2019 Aug 20. Anal Chem. 2019. PMID: 31393110
-
Design and testing of aptamer-based electrochemical biosensors for proteins and small molecules.Bioelectrochemistry. 2009 Nov;77(1):1-12. doi: 10.1016/j.bioelechem.2009.04.007. Epub 2009 May 5. Bioelectrochemistry. 2009. PMID: 19473883 Review.
Cited by
-
Regenerative Strategy of Gold Electrodes for Long-Term Reuse of Electrochemical Biosensors.ACS Omega. 2022 Dec 21;8(1):1389-1400. doi: 10.1021/acsomega.2c06851. eCollection 2023 Jan 10. ACS Omega. 2022. PMID: 36643538 Free PMC article.
-
Development of an Electrochemical, Aptamer-Based Sensor for Dynamic Detection of Neuropeptide Y.ACS Sens. 2023 Dec 22;8(12):4504-4511. doi: 10.1021/acssensors.3c00855. Epub 2023 Nov 30. ACS Sens. 2023. PMID: 38033269 Free PMC article.
-
Dual-Frequency, Ratiometric Approaches to EAB Sensor Interrogation Support the Calibration-Free Measurement of Specific Molecules In Vivo.ACS Sens. 2024 Jun 28;9(6):3205-3211. doi: 10.1021/acssensors.4c00516. Epub 2024 May 22. ACS Sens. 2024. PMID: 38775190 Free PMC article.
-
Real-Time, In Vivo Molecular Monitoring Using Electrochemical Aptamer Based Sensors: Opportunities and Challenges.ACS Sens. 2022 Oct 28;7(10):2823-2832. doi: 10.1021/acssensors.2c01428. Epub 2022 Oct 7. ACS Sens. 2022. PMID: 36205360 Free PMC article. Review.
-
Microscale, Electrochemical, Aptamer-Based Sensors for Enhanced Small-Molecule Detection at Millisecond Time Scales.ACS Sens. 2023 Dec 22;8(12):4521-4530. doi: 10.1021/acssensors.3c01055. Epub 2023 Nov 21. ACS Sens. 2023. PMID: 38104257 Free PMC article.
References
-
- Xiao Y; Lubin AA; Heeger AJ; Plaxco KW Label-Free Electronic Detection of Thrombin in Blood Serum by Using an Aptamer-Based Sensor. Angew. Chem. Int. Ed 2005, 44, 5456–5459. - PubMed
-
- Ferapontova EE; Olsen EM; Gothelf KV An RNA Aptamer-Based Electrochemical Biosensor for Detection of Theophylline in Serum An RNA Aptamer-Based Electrochemical Biosensor for Detection of Theophylline in Serum. J. Am. Chem. Soc 2008, 130, 1–4. - PubMed
-
- Baker BR; Lai RY; Wood MS; Doctor EH; Heeger AJ; Plaxco KW An Electronic, Aptamer-Based Small-Molecule Sensor for the Rapid, Label-Free Detection of Cocaine in Adulterated Samples and Biological Fluids. J. Am. Chem. Soc 2006, 128, 3138–3139. - PubMed
-
- Jarczewska M; Kekedy-Nagy L; Nielsen JS; Campos R; Kjems J; Malinowska E; Ferapontova EE Electroanalysis of PM-Levels of Urokinase Plasminogen Activator in Serum by Phosphorothioated RNA Aptamer. Analyst 2015, 140, 3794–3802. - PubMed
Publication types
MeSH terms
Substances
Grants and funding
LinkOut - more resources
Full Text Sources
Other Literature Sources
