Multicenter Study
. 2018 Sep;288(3):859-866.
doi: 10.1148/radiol.2018172294. Epub 2018 May 15.

CT-based Visual Classification of Emphysema: Association with Mortality in the COPDGene Study

Affiliations
Multicenter Study

CT-based Visual Classification of Emphysema: Association with Mortality in the COPDGene Study

David A Lynch et al. Radiology. 2018 Sep.

Abstract

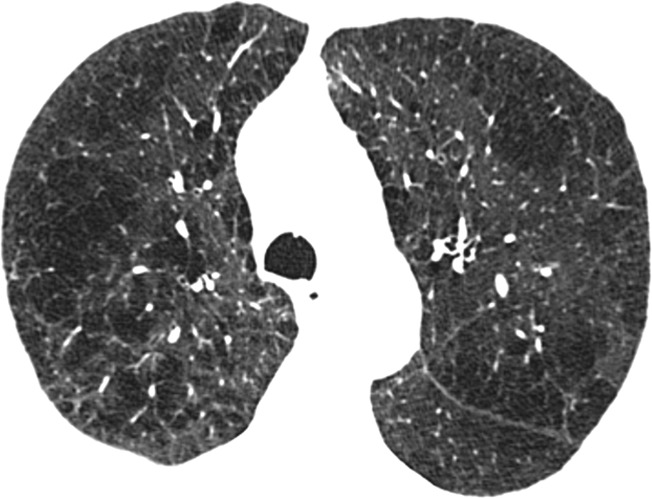
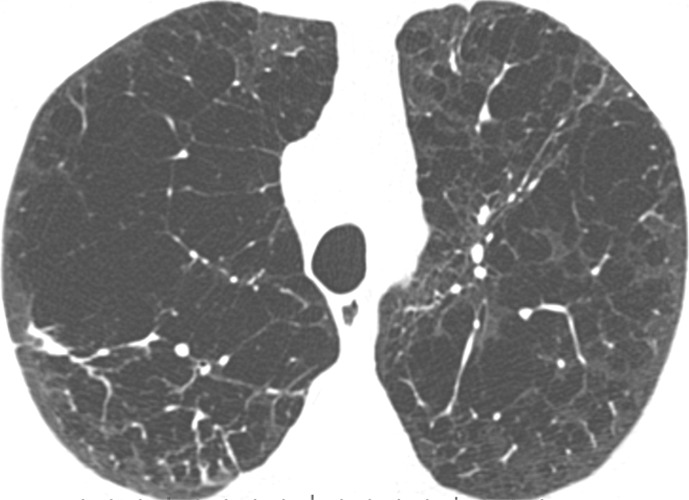
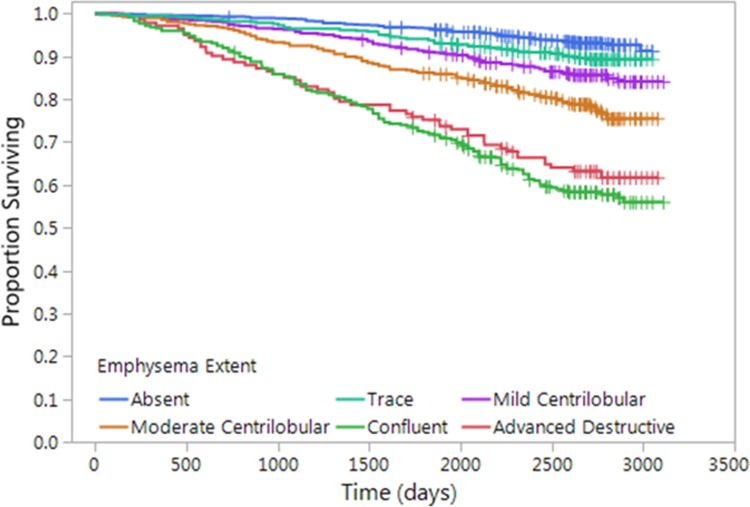
Purpose To determine whether visually assessed patterns of emphysema at CT might provide a simple assessment of mortality risk among cigarette smokers. Materials and Methods Of the first 4000 cigarette smokers consecutively enrolled between 2007 and 2011 in this COPDGene study, 3171 had data available for both visual emphysema CT scores and survival. Each CT scan was retrospectively visually scored by two analysts using the Fleischner Society classification system. Severity of emphysema was also evaluated quantitatively by using percentage lung volume occupied by low-attenuation areas (voxels with attenuation of -950 HU or less) (LAA-950). Median duration of follow-up was 7.4 years. Regression analysis for the relationship between imaging patterns and survival was based on the Cox proportional hazards model, with adjustment for age, race, sex, height, weight, pack-years of cigarette smoking, current smoking status, educational level, LAA-950, and (in a second model) forced expiratory volume in 1 second (FEV1). Results Observer agreement in visual scoring was good (weighted κ values, 0.71-0.80). There were 519 deaths in the study cohort. Compared with subjects who did not have visible emphysema, mortality was greater in those with any grade of emphysema beyond trace (adjusted hazard ratios, 1.7, 2.5, 5.0, and 4.1, respectively, for mild centrilobular emphysema, moderate centrilobular emphysema, confluent emphysema, and advanced destructive emphysema, P < .001). This increased mortality generally persisted after adjusting for LAA-950. Conclusion The visual presence and severity of emphysema is associated with significantly increased mortality risk, independent of the quantitative severity of emphysema. Online supplemental material is available for this article.


Figures

Figure 1a:
Figure 1a:
Axial CT images show severity grades of parenchymal emphysema. (a) Normal CT scan shows no emphysema. (b) Image shows trace centrilobular emphysema (circle), which involved less than 0.5% of the lung zone. (c) Image shows mild centrilobular emphysema (arrows), which involved 0.5%–5.0% of the lung zone. (d) Image shows moderate centrilobular emphysema, which involved more than 5% of the lung zone. (e) Confluent emphysema. (f) Advanced destructive emphysema with vascular distortion.
Figure 1b:
Figure 1b:
Axial CT images show severity grades of parenchymal emphysema. (a) Normal CT scan shows no emphysema. (b) Image shows trace centrilobular emphysema (circle), which involved less than 0.5% of the lung zone. (c) Image shows mild centrilobular emphysema (arrows), which involved 0.5%–5.0% of the lung zone. (d) Image shows moderate centrilobular emphysema, which involved more than 5% of the lung zone. (e) Confluent emphysema. (f) Advanced destructive emphysema with vascular distortion.
Figure 1c:
Figure 1c:
Axial CT images show severity grades of parenchymal emphysema. (a) Normal CT scan shows no emphysema. (b) Image shows trace centrilobular emphysema (circle), which involved less than 0.5% of the lung zone. (c) Image shows mild centrilobular emphysema (arrows), which involved 0.5%–5.0% of the lung zone. (d) Image shows moderate centrilobular emphysema, which involved more than 5% of the lung zone. (e) Confluent emphysema. (f) Advanced destructive emphysema with vascular distortion.
Figure 1d:
Figure 1d:
Axial CT images show severity grades of parenchymal emphysema. (a) Normal CT scan shows no emphysema. (b) Image shows trace centrilobular emphysema (circle), which involved less than 0.5% of the lung zone. (c) Image shows mild centrilobular emphysema (arrows), which involved 0.5%–5.0% of the lung zone. (d) Image shows moderate centrilobular emphysema, which involved more than 5% of the lung zone. (e) Confluent emphysema. (f) Advanced destructive emphysema with vascular distortion.
Figure 1e:
Figure 1e:
Axial CT images show severity grades of parenchymal emphysema. (a) Normal CT scan shows no emphysema. (b) Image shows trace centrilobular emphysema (circle), which involved less than 0.5% of the lung zone. (c) Image shows mild centrilobular emphysema (arrows), which involved 0.5%–5.0% of the lung zone. (d) Image shows moderate centrilobular emphysema, which involved more than 5% of the lung zone. (e) Confluent emphysema. (f) Advanced destructive emphysema with vascular distortion.
Figure 1f:
Figure 1f:
Axial CT images show severity grades of parenchymal emphysema. (a) Normal CT scan shows no emphysema. (b) Image shows trace centrilobular emphysema (circle), which involved less than 0.5% of the lung zone. (c) Image shows mild centrilobular emphysema (arrows), which involved 0.5%–5.0% of the lung zone. (d) Image shows moderate centrilobular emphysema, which involved more than 5% of the lung zone. (e) Confluent emphysema. (f) Advanced destructive emphysema with vascular distortion.
Figure 2:
Figure 2:
Graph shows relationship between parenchymal emphysema pattern and survival. Kaplan-Meier curves show decreasing survival with increasing grade of emphysema severity.

References

    1. Deaths, percent of total deaths, and death rates for the 15 leading causes of death: United States and each State, 2014. National Center for Health Statistics. https://www.cdc.gov/nchs/data/dvs/lcwk9_2014.pdf. Updated December 1, 2015. Accessed April 26, 2017.
    1. Celli BR. Predictors of mortality in COPD. Respir Med 2010;104(6):773–779. - PubMed
    1. Oelsner EC, Carr JJ, Enright PL, et al. Per cent emphysema is associated with respiratory and lung cancer mortality in the general population: a cohort study. Thorax 2016;71(7):624–632. - PMC - PubMed
    1. Johannessen A, Skorge TD, Bottai M, et al. Mortality by level of emphysema and airway wall thickness. Am J Respir Crit Care Med 2013;187(6):602–608. - PubMed
    1. Friedlander AL, Lynch D, Dyar LA, Bowler RP. Phenotypes of chronic obstructive pulmonary disease. COPD 2007;4(4):355–384. - PubMed

Publication types