Comparative Study
. 2018 Aug 1;35(8):1947-1957.
doi: 10.1093/molbev/msy097.

Lipidome Evolution in Mammalian Tissues

Affiliations
Comparative Study

Lipidome Evolution in Mammalian Tissues

Ekaterina Khrameeva et al. Mol Biol Evol. .

Abstract

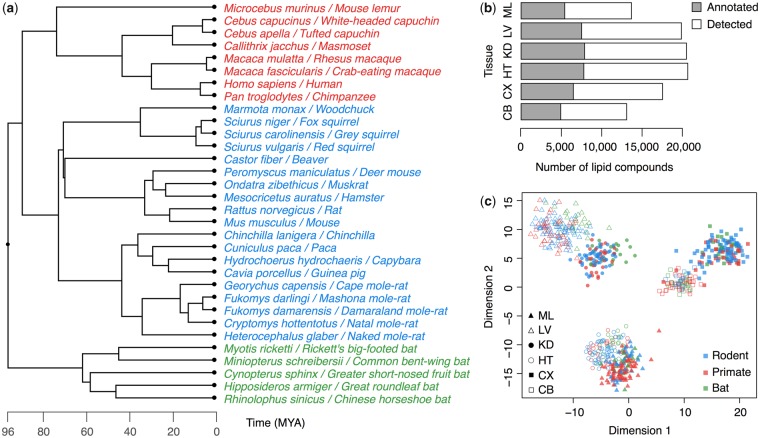
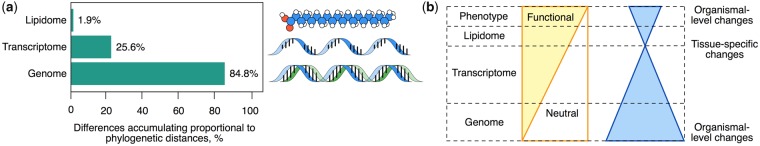
Lipids are essential structural and functional components of cells. Little is known, however, about the evolution of lipid composition in different tissues. Here, we report a large-scale analysis of the lipidome evolution in six tissues of 32 species representing primates, rodents, and bats. While changes in genes' sequence and expression accumulate proportionally to the phylogenetic distances, <2% of the lipidome evolves this way. Yet, lipids constituting this 2% cluster in specific functions shared among all tissues. Among species, human show the largest amount of species-specific lipidome differences. Many of the uniquely human lipidome features localize in the brain cortex and cluster in specific pathways implicated in cognitive disorders.


Figures

<sc>Fig</sc>. 1.
Fig. 1.
Data overview. (a) Phylogenetic tree of 32 mammalian species used in this study. The colors indicate three main represented clades: rodents (blue), primates (red), and bats (green). (b) Numbers of lipids detected in each tissue. Gray bars represent annotated lipids. Here and later the tissues are labeled by a two-letter code: CB, cerebellum; CX, cortex; HT, heart; KD, kidney; LV, liver; ML, muscle. (c) The relationship among samples are based on concentrations of 1,231 annotated lipids plotted in two dimensions using a multidimensional scaling algorithm. Symbols represent tissues, colors represent clades, and points represent individual samples.
<sc>Fig</sc>. 2.
Fig. 2.
Relationship between lipid concentrations and phylogenetic distances. (a) Percentages of lipids with concentration differences among species scaling with phylogenetic distances (phylogeny-dependent lipids) in each of six tissues. Stars indicate the significance of the difference between observed number distributions and random expectation (permutations of species labels, P < 0.001). (b) Percentages of phylogenetic genes (violet) and lipids (green) defined based on the same criteria in three tissues in a matching subset of eight species. The expression data was taken from Fushan et al. (2015). (c) Distribution of concentration differences measured in all pairwise comparisons between species for phylogeny-dependent lipids (blue) and the remaining lipids (light gray). Stars indicate the significance of the difference between the two distributions (two-sided t-test P < 0.0001, n = 66,176). (d) Distribution of concentration differences among individuals within species for phylogeny-dependent lipids (blue) and the remaining lipids (light gray). Stars indicate the significance of the difference between the two distributions (two-sided t-test P < 0.0001, n = 3,916). (e) Enrichment of phylogeny-dependent lipids in specific lipid classes and subclasses. Colors indicate BH-corrected enrichment P values.
<sc>Fig</sc>. 3.
Fig. 3.
Species-specific lipid concentration differences. (a) Numbers of lipids showing significant species-specific concentration differences. The distributions show the numbers of such lipids in each of 23 lineages represented by at least three biological replicates in a given tissue. (b) Numbers of lipids showing significant species-specific concentration differences in each of 104 tissue and lineage combinations (normalized by the phylogenetic distances). Error bars show variations of estimates calculated by way of the random sampling of three individuals per species. Stars and bar colors indicate the significance of the difference between observed number distributions and random expectation (permutations, ** and red—P < 0.05, * and pink—P < 0.1). Green circles indicate the significance of the difference between observed number distributions and random expectation according to the OU model (permutations, ooP < 0.05, oP < 0.1). The rightmost column shows the cumulative lineage effect calculated as an average -log10 P value of the difference between observed and chance numbers of species-specific lipids across tissues. (c) Lipid concentration differences between humans and the other three species (chimpanzee, macaque, and mouse) calculated as log2-transformed fold changes of the average values for 183 lipids showing a significant human-specific concentration difference in our data (Data Set 1) and detected in the published data set (Data Set 2) (Bozek et al. 2015). Colors indicate signs of log2-transformed fold changes in both data sets. The ellipse shows a 90% confidence interval. (d) An example of the concentrations in the kidney of one lipid (monogalactosyldiacylglycerol, LMGL05010014) shown in the panel (c). (e) Enrichment of lipids with human-specific concentration differences in specific lipid classes and subclasses. Colors indicate BH-corrected enrichment P values.
<sc>Fig</sc>. 4.
Fig. 4.
Characterization of lipids showing human-specific concentration levels (HS-lipids) in cortex. (a) Distribution showing numbers of protein-coding genes with human-specific expression in cortex linked to HS-lipids (violet) and control lipids (gray). Stars indicate the significance of the difference between the two distributions (two-tailed t-test P < 0.001, n = 257). (b) Enrichment of protein-coding genes linked to HS-lipids in KEGG pathways. Symbols represent pathways. The numbers next to the symbols and the legend above the panel show the top three enriched pathways. (c) The simplified schematic representation of the top three enriched KEGG pathways showing HS-lipids and their linked genes. The background colors indicate the pathways, as in panel (b) legend.
<sc>Fig</sc>. 5.
Fig. 5.
Evolution of two mutually exclusive groups of lipid-metabolizing enzymes: 1) enzymes linked to brain-specific lipids and 2) enzymes linked to nonbrain-specific lipids. Brain-specific lipids were defined as the 20% of lipids with the highest log2-transformed fold-change of the average concentration difference between brain and the other tissues. Nonbrain-specific lipids were defined as 20% of lipids with the lowest log2-transformed fold-change in the same comparison. (a) Dn and Ds values of the two groups of lipid-metabolizing enzymes. (b) Dn/Ds ratios of the two groups of lipid-metabolizing enzymes. (c) Average expression levels of the two groups of lipid-metabolizing enzymes. The colors indicate the enzymes linked to brain-specific lipids (red) and the enzymes linked to nonbrain-specific lipids (blue).
<sc>Fig</sc>. 6.
Fig. 6.
Evolution at lipidome, transcriptome and genome levels. (a) Percentages of lipids, protein-coding transcripts and genes with differences among species accumulating proportionally to phylogenetic distances. (b) Schematic representation of the suggested lipidome evolution properties in comparison to the other levels of molecular and organismal phenotype. Left: relative proportions of neutral and functional differences among species. Right: proportion of evolutionary differences shared among tissues. The vertical axis shows the relevant levels of organismal organization. The inversion of this proportion between the transcriptome and lipidome levels reflects the notion that ubiquitously present transcriptome differences are mainly neutral and lipidome ones are mainly functional.

Similar articles

Cited by

References

    1. Adibhatla RM, Hatcher JF, Dempsey RJ.. 2006. Lipids and lipidomics in brain injury and diseases. AAPS J 82:E314–E321. - PMC - PubMed
    1. Ariga T, McDonald MP, Yu RK.. 2008. Role of ganglioside metabolism in the pathogenesis of Alzheimer’s disease—a review. J Lipid Res. 496:1157–1175. - PMC - PubMed
    1. Bozek K, Khrameeva EE, Reznick J, Omerbašić D, Bennett NC, Lewin GR, Azpurua J, Gorbunova V, Seluanov A, Regnard P, et al. . 2017. Lipidome determinants of maximal lifespan in mammals. Sci Rep. 71:5. - PMC - PubMed
    1. Bozek K, Wei Y, Yan Z, Liu X, Xiong J, Sugimoto M, Tomita M, Pääbo S, Sherwood CC, Hof Patrick R, et al. . 2015. Organization and evolution of brain lipidome revealed by large-scale analysis of human, chimpanzee, macaque, and mouse tissues. Neuron 854:695–702. - PubMed
    1. Brawand D, Soumillon M, Necsulea A, Julien P, Csárdi G, Harrigan P, Weier M, Liechti A, Aximu-Petri A, Kircher M, et al. . 2011. The evolution of gene expression levels in mammalian organs. Nature 4787369:343–348. - PubMed

Publication types

LinkOut - more resources