

Comprehensive evaluation of blood-brain barrier-forming micro-vasculatures: Reference and marker genes with cellular composition
- PMID: 29763456
- PMCID: PMC5953434
- DOI: 10.1371/journal.pone.0197379
Comprehensive evaluation of blood-brain barrier-forming micro-vasculatures: Reference and marker genes with cellular composition
Abstract
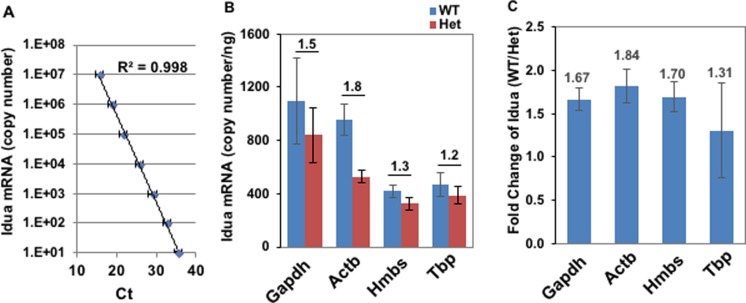
Primary brain microvessels (BrMV) maintain the cellular characters and molecular signatures as displayed in vivo, and serve as a vital tool for biomedical research of the blood-brain barrier (BBB) and the development/optimization of brain drug delivery. The variations of relative purities or cellular composition among different BrMV samples may have significant consequences in data interpretation and research outcome, especially for experiments with high-throughput genomics and proteomics technologies. In this study, we aimed to identify suitable reference gene (RG) for accurate normalization of real-time RT-qPCR analysis, and determine the proper marker genes (MG) for relative purity assessment in BrMV samples. Out of five housekeeping genes, β-actin was selected as the most suitable RG that was validated by quantifying mRNA levels of alpha-L-iduronidase in BrMV isolated from mice with one or two expressing alleles. Four marker genes highly/selectively expressed in BBB-forming capillary endothelial cells were evaluated by RT-qPCR for purity assessment, resulting in Cldn5 and Pecam1 as most suitable MGs that were further confirmed by immunofluorescent analysis of cellular components. Plvap proved to be an indicator gene for the presence of fenestrated vessels in BrMV samples. This study may contribute to the building blocks toward overarching research needs on the blood-brain barrier.
Conflict of interest statement
Figures


Similar articles
-
Culture-induced changes in mRNA expression levels of efflux and SLC-transporters in brain endothelial cells.Fluids Barriers CNS. 2020 Apr 22;17(1):32. doi: 10.1186/s12987-020-00193-5. Fluids Barriers CNS. 2020. PMID: 32321539 Free PMC article.
-
In vitro models of the blood-brain barrier.Methods Mol Biol. 2014;1135:415-37. doi: 10.1007/978-1-4939-0320-7_34. Methods Mol Biol. 2014. PMID: 24510883
-
Endothelial cell heterogeneity of blood-brain barrier gene expression along the cerebral microvasculature.J Neurosci Res. 2010 May 15;88(7):1457-74. doi: 10.1002/jnr.22316. J Neurosci Res. 2010. PMID: 20025060
-
Understanding the blood-brain barrier using gene and protein expression profiling technologies.Brain Res Rev. 2009 Dec 11;62(1):83-98. doi: 10.1016/j.brainresrev.2009.09.004. Epub 2009 Sep 19. Brain Res Rev. 2009. PMID: 19770003 Review.
-
Molecular biology of the blood-brain barrier.Mol Biotechnol. 2005 May;30(1):57-70. doi: 10.1385/MB:30:1:057. Mol Biotechnol. 2005. PMID: 15805577 Review.
Cited by
-
Intrinsic link between PGRN and Gba1 D409V mutation dosage in potentiating Gaucher disease.Hum Mol Genet. 2024 Oct 7;33(20):1771-1788. doi: 10.1093/hmg/ddae113. Hum Mol Genet. 2024. PMID: 39101473 Free PMC article.
-
Spatial transcriptomics at the brain-electrode interface in rat motor cortex and the relationship to recording quality.J Neural Eng. 2024 Jul 31;21(4):046033. doi: 10.1088/1741-2552/ad5936. J Neural Eng. 2024. PMID: 38885679 Free PMC article.
-
Identification of Reference Genes for Circadian Studies on Brain Microvessels and Choroid Plexus Samples Isolated from Rats.Biomolecules. 2021 Aug 17;11(8):1227. doi: 10.3390/biom11081227. Biomolecules. 2021. PMID: 34439891 Free PMC article.
-
miR-143 Regulates Lysosomal Enzyme Transport across the Blood-Brain Barrier and Transforms CNS Treatment for Mucopolysaccharidosis Type I.Mol Ther. 2020 Oct 7;28(10):2161-2176. doi: 10.1016/j.ymthe.2020.06.011. Epub 2020 Jun 15. Mol Ther. 2020. PMID: 32610100 Free PMC article.
-
Beta-amyloid pathology in human brain microvessel extracts from the parietal cortex: relation with cerebral amyloid angiopathy and Alzheimer's disease.Acta Neuropathol. 2019 May;137(5):801-823. doi: 10.1007/s00401-019-01967-4. Epub 2019 Feb 7. Acta Neuropathol. 2019. PMID: 30729296 Free PMC article.
References
-
- Zhao Z, Nelson AR, Betsholtz C, Zlokovic BV. Establishment and Dysfunction of the Blood-Brain Barrier. Cell. 2015;163(5):1064–78. doi: 10.1016/j.cell.2015.10.067 ; PubMed Central PMCID: PMC4655822. - DOI - PMC - PubMed
-
- Ochocinska MJ, Zlokovic BV, Searson PC, Crowder AT, Kraig RP, Ljubimova JY, et al. NIH workshop report on the trans-agency blood-brain interface workshop 2016: exploring key challenges and opportunities associated with the blood, brain and their interface. Fluids and barriers of the CNS. 2017;14(1):12 doi: 10.1186/s12987-017-0061-6 ; PubMed Central PMCID: PMC5410699. - DOI - PMC - PubMed
-
- Montagne A, Zhao Z, Zlokovic BV. Alzheimer's disease: A matter of blood-brain barrier dysfunction? J Exp Med. 2017;214(11):3151–69. doi: 10.1084/jem.20171406 ; PubMed Central PMCID: PMCPMC5679168. - DOI - PMC - PubMed
-
- Salvalaio M, Rigon L, Belletti D, D'Avanzo F, Pederzoli F, Ruozi B, et al. Targeted Polymeric Nanoparticles for Brain Delivery of High Molecular Weight Molecules in Lysosomal Storage Disorders. PloS one. 2016;11(5):e0156452 doi: 10.1371/journal.pone.0156452 ; PubMed Central PMCID: PMCPMC4881964. - DOI - PMC - PubMed
Publication types
MeSH terms
Substances
Grants and funding
LinkOut - more resources
Full Text Sources
Other Literature Sources
Molecular Biology Databases
Miscellaneous
