Clinical Trial
. 2018 May 14;33(5):829-842.e5.
doi: 10.1016/j.ccell.2018.04.004.

Molecular, Pathological, Radiological, and Immune Profiling of Non-brainstem Pediatric High-Grade Glioma from the HERBY Phase II Randomized Trial

Affiliations
Clinical Trial

Molecular, Pathological, Radiological, and Immune Profiling of Non-brainstem Pediatric High-Grade Glioma from the HERBY Phase II Randomized Trial

Alan Mackay et al. Cancer Cell. .

Abstract

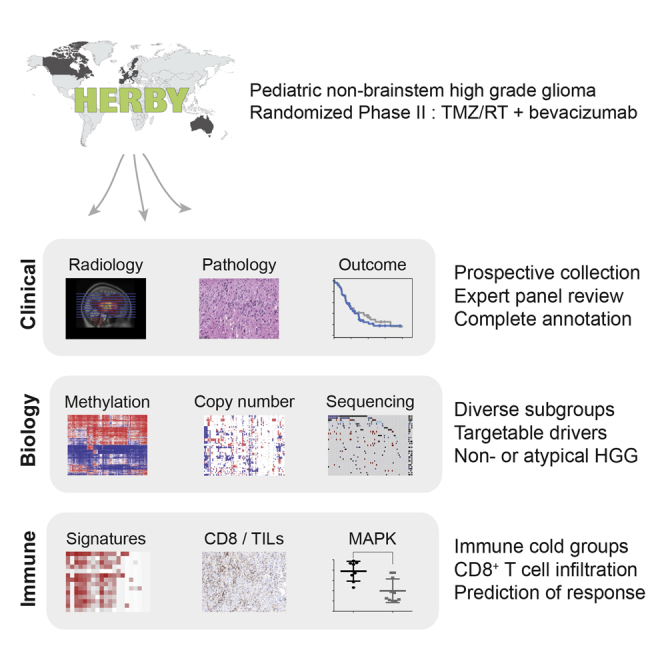
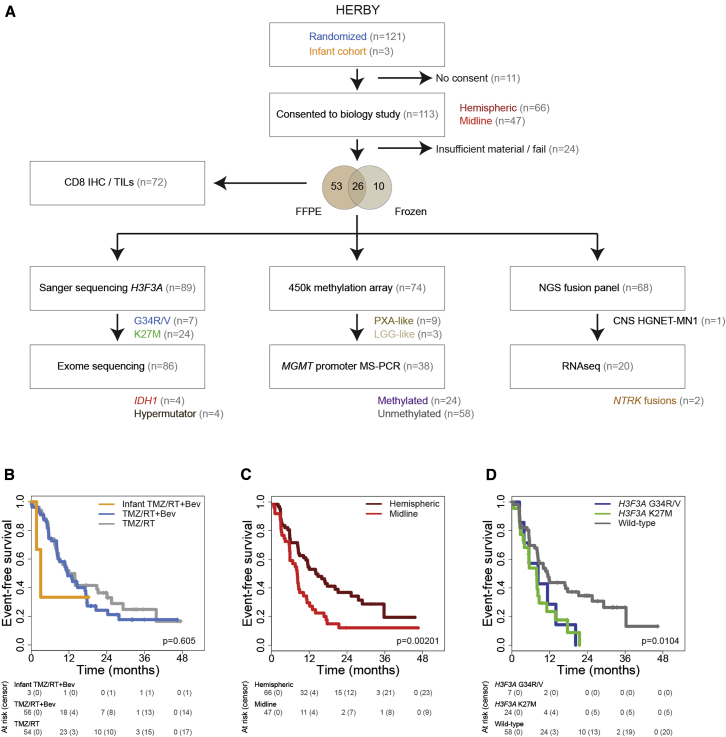
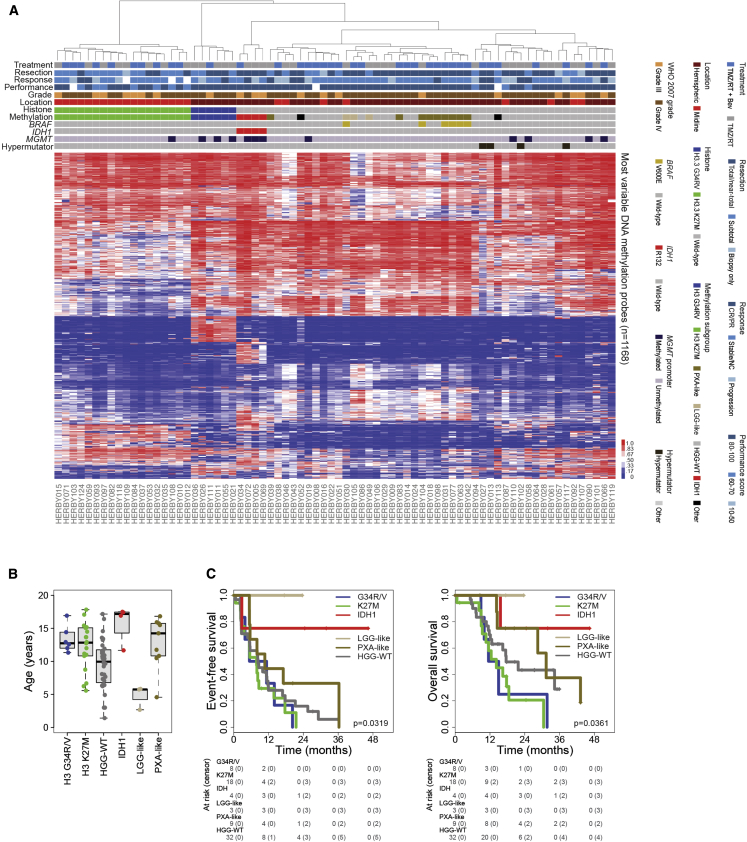
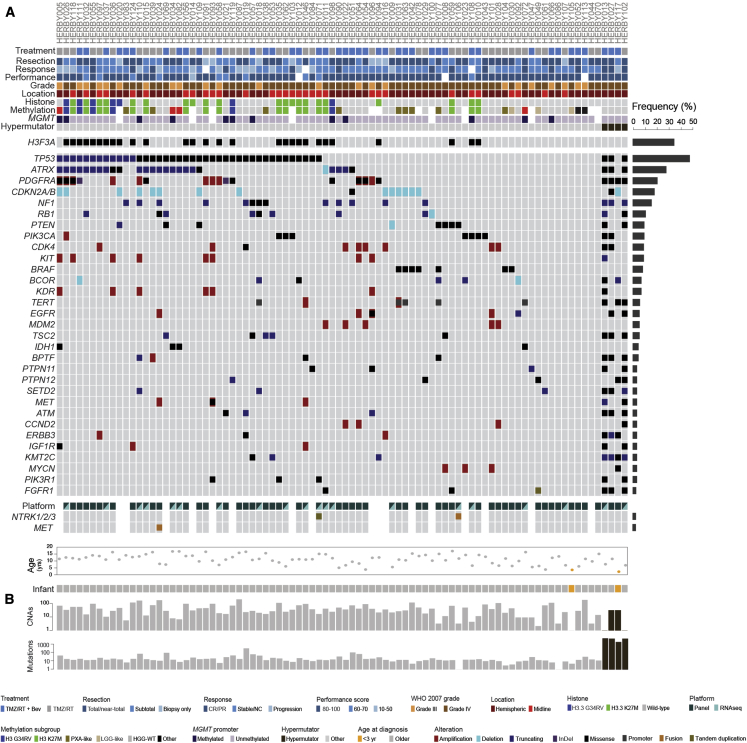
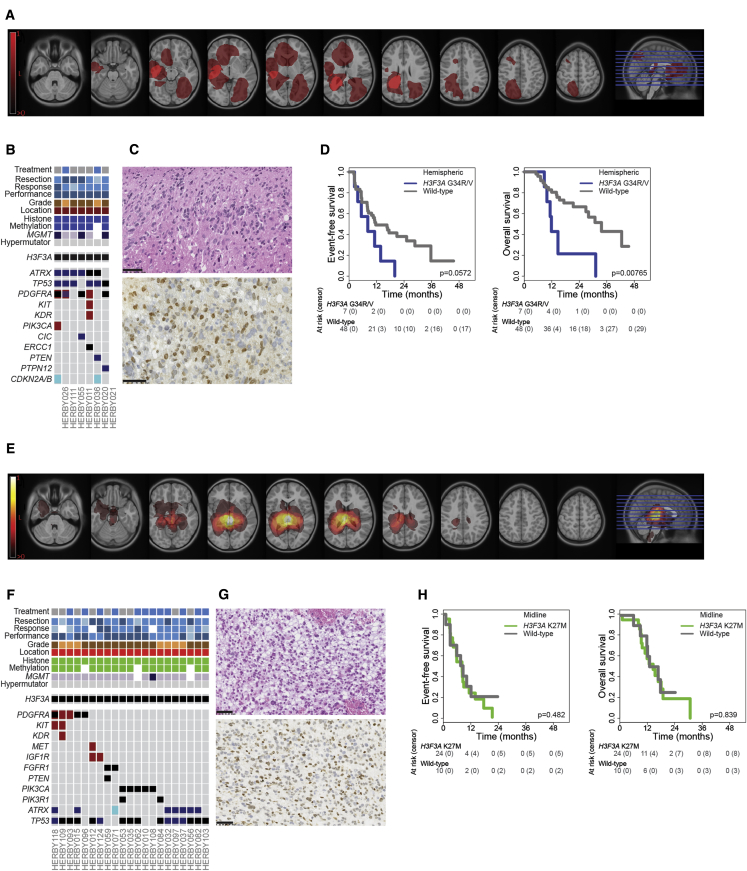
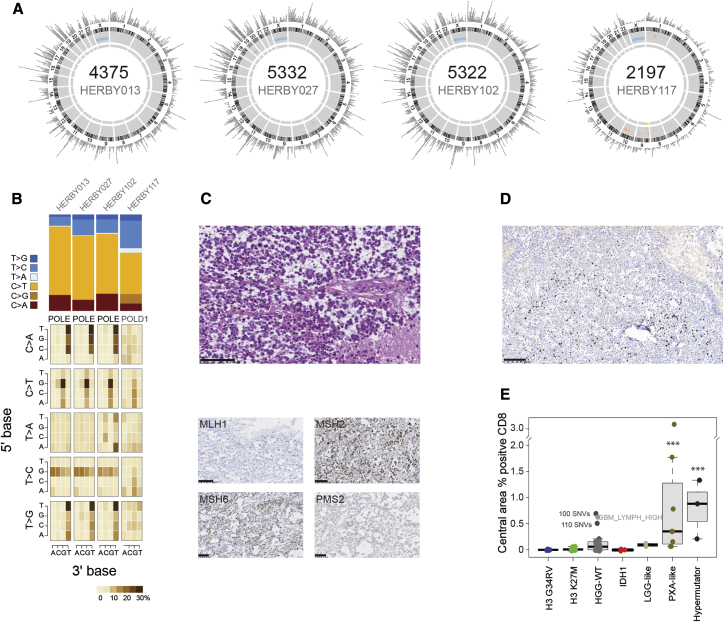
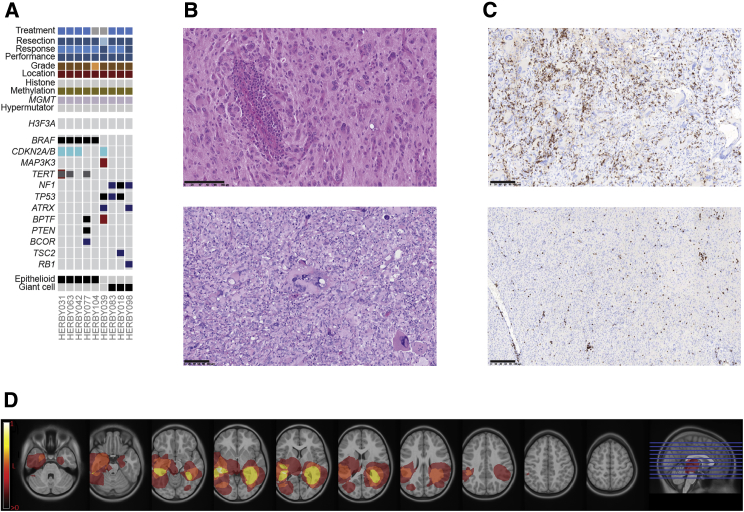
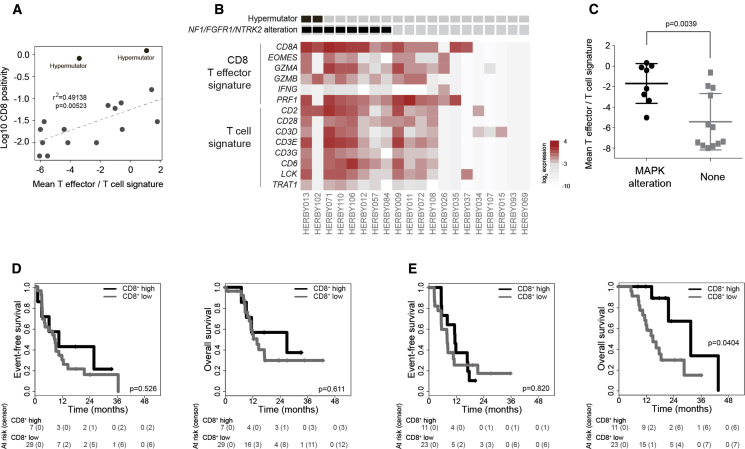
The HERBY trial was a phase II open-label, randomized, multicenter trial evaluating bevacizumab (BEV) in addition to temozolomide/radiotherapy in patients with newly diagnosed non-brainstem high-grade glioma (HGG) between the ages of 3 and 18 years. We carried out comprehensive molecular analysis integrated with pathology, radiology, and immune profiling. In post-hoc subgroup analysis, hypermutator tumors (mismatch repair deficiency and somatic POLE/POLD1 mutations) and those biologically resembling pleomorphic xanthoastrocytoma ([PXA]-like, driven by BRAF_V600E or NF1 mutation) had significantly more CD8+ tumor-infiltrating lymphocytes, and longer survival with the addition of BEV. Histone H3 subgroups (hemispheric G34R/V and midline K27M) had a worse outcome and were immune cold. Future clinical trials will need to take into account the diversity represented by the term "HGG" in the pediatric population.

Trial registration: ClinicalTrials.gov NCT01390948.

Keywords: CD8; H3F3A; MAPK; hypermutator; immune; pediatric high-grade glioma.


Figures

None
Graphical abstract
Figure 1
Figure 1
Sample Cohort (A) Flow diagram indicating total HERBY trial cohort (n = 121 randomized plus 3 infants), those patients consenting to the biology study (n = 113) for whom sufficient formalin-fixed paraffin-embedded (FFPE) or frozen tumor was available (n = 89), and the respective molecular analyses undertaken. (B–D) Kaplan-Meier plots of event-free survival of cases (y axis) separated by treatment arm (B), anatomical location (C), or H3F3A status (D), with time given in months (x axis) and the overall p value provided, calculated by the log rank test. Individual pairwise comparisons are provided in the text. See also Table S1.
Figure 2
Figure 2
Methylation-Based Subclassification (A) Heatmap representation of β values for 74 samples profiled on the Illumina 450k BeadChip platform (red, high; blue, low). Samples are arranged in columns clustered by probes with the largest median absolute deviation across the 10k predictor subset of probes. Clinicopathological and molecular annotations are provided as bars according to the included key. CR/PR, complete response or partial response; Stable/NC, stable disease or no change. (B) Boxplot showing age at diagnosis of included cases, separated by methylation subclass. The thick line within the box is the median, the lower and upper limits of the boxes represent the first and third quartiles, and the whiskers 1.5× the interquartile range. (C) Kaplan-Meier plot of event-free and overall survival of cases (y axis) separated by methylation subclass, time given in months (x axis) and overall p value calculated by the log rank test. See also Figure S1 and Table S2.
Figure 3
Figure 3
Somatic Mutations (A) Oncoprint representation of an integrated annotation of somatic mutations and DNA copy-number changes for the 30 most frequently altered genes in 86 samples (n ≥ 3, frequency barplot on the right, excluding hypermutator cases). Selected common fusion events are also shown where available. Samples are arranged in columns with genes labeled along rows. (B) Barplots are provided on a log10 scale for numbers of copy-number aberrations and somatic mutations per case. Clinicopathological and molecular annotations are provided as bars according to the included key. CR/PR, complete response or partial response; Stable/NC, stable disease or no change. See also Figures S2 and S3 and Table S3.
Figure 4
Figure 4
H3F3A Mutant Subgroups (A–D) H3F3A_G34R/V. (A) Radiological tumor lesion map of 7 H3F3A_G34R/V cases. Brighter colored pixels indicate a higher probability of tumor incidence. (B) Integrated annotation of somatic mutations and DNA copy-number changes in H3F3A_G34R/V cases. Clinicopathological and molecular annotations are provided as bars according to the included key in Figure 3. (C) H&E (top) and immunohistochemistry (bottom) directed against H3.3G34R for HERBY020. Scale bars, 50 μm. (D) Kaplan-Meier plot of event-free and overall survival of 55 hemispheric cases (y axis) separated by H3F3A status, time given in months (x axis), p value calculated by the log rank test. (E–H) H3F3A_K27M. (E) Radiological tumor lesion map of 21 H3F3A_K27M cases. Brighter colored pixels indicate a higher probability of tumor incidence. (F) Integrated data from H3F3A_K27M cases. Clinicopathological and molecular annotations are provided as bars according to the included key in Figure 3. (G) H&E (top) and immunohistochemistry (bottom) directed against H3.3K27M for HERBY015. Scale bars 50 μm. (H) Kaplan-Meier plot of event-free and overall survival of 34 midline cases (y axis) separated by H3F3A status, time given in months (x axis), p value calculated by the log rank test. See also Figure S4.
Figure 5
Figure 5
Hypermutator Cases (A) Circos plots for four hypermutator cases. In each case, plots provide somatic SNVs and insertion/deletions on the outer ring, DNA copy-number changes (dark red, amplification; red, gain; dark blue, deletion; blue, loss), and loss of heterozygosity (yellow) on the inner rings, and intra- (orange) and inter- (blue) chromosomal translocations inside the circle. (B) Mutation signatures. Top: simple stacked barplot representation of the proportion of mutation types observed in individual hypermutator cases and the remaining accumulated dataset. Base changes given in the key. Bottom: mutation context given for each of the 96 mutated trinucleotides, represented by heatmap. The base located 5′ to each mutated base is shown on the vertical axis, and the 3′ base is on the horizontal axis. (C) H&E (top) and protein expression of mismatch repair proteins (bottom panel, clockwise from top left: MLH1, MSH2, MSH6, and PMS2) as assessed by immunohistochemistry in a glioblastoma with 5,322 somatic mutations (HERBY102). Scale bars, 100 μm (H&E, MLH1, MSH2) or 50 μm (MSH6, PMS2). (D) CD8 expression in T cells by immunohistochemistry in HERBY102. Scale bar, 100 μm. (E) Boxplot of percentage of CD8+ cells in the central tumor region separated by subgroup. The thick line within the box is the median, the lower and upper limits of the boxes represent the first and third quartiles, and the whiskers 1.5× the interquartile range. ∗∗∗p < 0.0001, t test. See also Figure S5 and Table S4.
Figure 6
Figure 6
PXA-like Tumors (A) Integrated annotation of somatic mutations and DNA copy-number changes in nine samples classifying as PXA-like. Clinicopathological and molecular annotations are provided as bars according to the included key in Figure 3. (B) H&E staining of an epithelioid (top, HERBY104) and giant cell (bottom, HERBY098) variant of glioblastoma. Scale bars, 100 μm. (C) CD8 immunohistochemistry for the same cases as (B), marking CD8+ T cells. Scale bars, 100 μm. (D) Radiological tumor lesion map of PXA-like cases. Brighter colored pixels indicate a higher probability of tumor incidence.
Figure 7
Figure 7
Immune Signatures and Response to BEV (A) Mean T effector/T cell gene expression values (plotted as log2, x axis) were correlated with CD8 immunoreactivity (plotted as log10, y axis) for 18 cases. Two cases were scored as 0% by immunohistochemistry and were not plotted (expression values −7.37 and −7.58). (B) Gene expression signatures for CD8 T effector and T cells plotted as a heatmap from 20 cases with RNA-seq data. Hypermutator cases and those with MAPK alterations including NF1, FGFR1, or NTRK2 are annotated. (C) Plot of T effector/T cell gene expression values in MAPK-altered samples compared with those without. Horizontal bar represents the mean, error bars the SD. (D) Kaplan-Meier plot of event-free and overall survival of 36 cases (y axis) treated with TMZ/RT, separated by levels of CD8+ T cells, time given in months (x axis), and p value calculated by the log rank test. (E) Kaplan-Meier plot of event-free and overall survival of 34 cases (y axis) treated with TMZ/RT plus BEV, separated by levels of CD8+ T cells, time given in months (x axis), and p value calculated by the log rank test. See also Figures S6 and S7 and Table S5.

References

    1. Bautista F., Paci A., Minard-Colin V., Dufour C., Grill J., Lacroix L., Varlet P., Valteau-Couanet D., Geoerger B. Vemurafenib in pediatric patients with BRAFV600E mutated high-grade gliomas. Pediatr. Blood Cancer. 2014;61:1101–1103. - PubMed
    1. Benesch M., Windelberg M., Sauseng W., Witt V., Fleischhack G., Lackner H., Gadner H., Bode U., Urban C. Compassionate use of bevacizumab (Avastin) in children and young adults with refractory or recurrent solid tumors. Ann. Oncol. 2008;19:807–813. - PubMed
    1. Bjerke L., Mackay A., Nandhabalan M., Burford A., Jury A., Popov S., Bax D.A., Carvalho D., Taylor K.R., Vinci M. Histone H3.3. mutations drive pediatric glioblastoma through upregulation of MYCN. Cancer Discov. 2013;3:512–519. - PMC - PubMed
    1. Bouffet E., Larouche V., Campbell B.B., Merico D., de Borja R., Aronson M., Durno C., Krueger J., Cabric V., Ramaswamy V. Immune checkpoint inhibition for hypermutant glioblastoma multiforme resulting from germline biallelic mismatch repair deficiency. J. Clin. Oncol. 2016;34:2206–2211. - PubMed
    1. Brouwer-Visser J., Cheng W.Y., Bauer-Mehren A., Maisel D., Lechner K., Andersson E., Dudley J.T., Milletti F. Regulatory T-cell genes drive altered immune microenvironment in adult solid cancers and allow for immune contextual patient subtyping. Cancer Epidemiol. Biomarkers Prev. 2018;27:103–112. - PubMed

Publication types

Associated data