. 2018 May 14;33(5):905-921.e5.
doi: 10.1016/j.ccell.2018.04.002.

The GSK3 Signaling Axis Regulates Adaptive Glutamine Metabolism in Lung Squamous Cell Carcinoma

Affiliations

The GSK3 Signaling Axis Regulates Adaptive Glutamine Metabolism in Lung Squamous Cell Carcinoma

Milica Momcilovic et al. Cancer Cell. .

Abstract

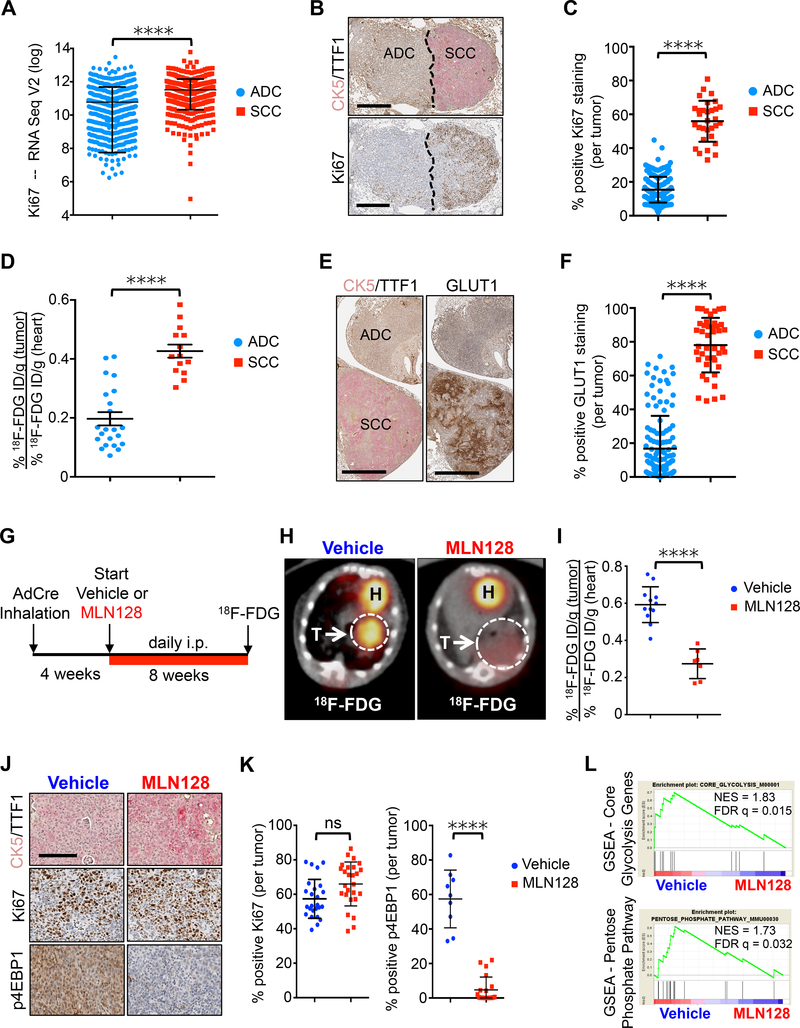
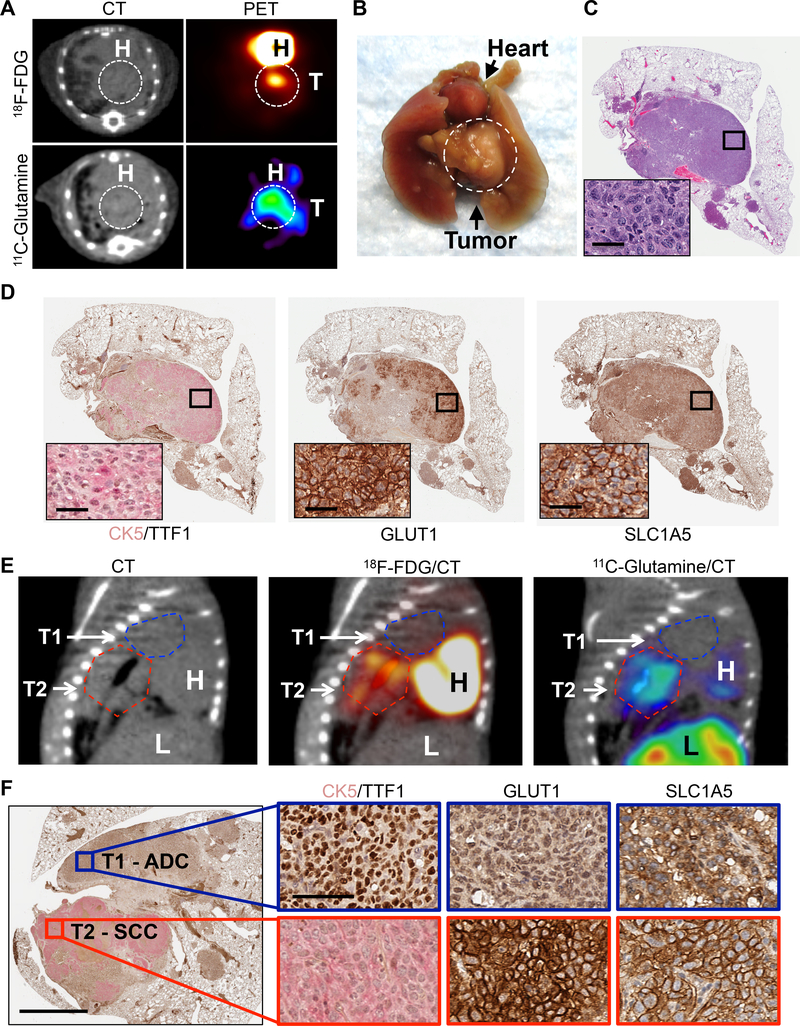
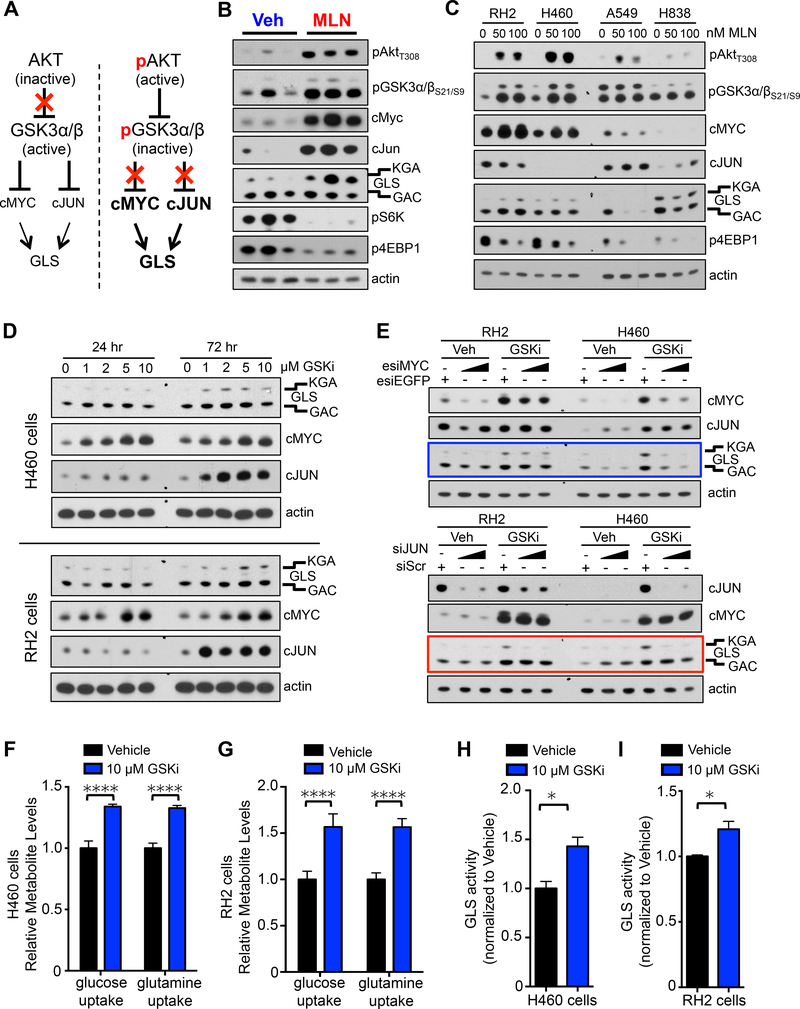
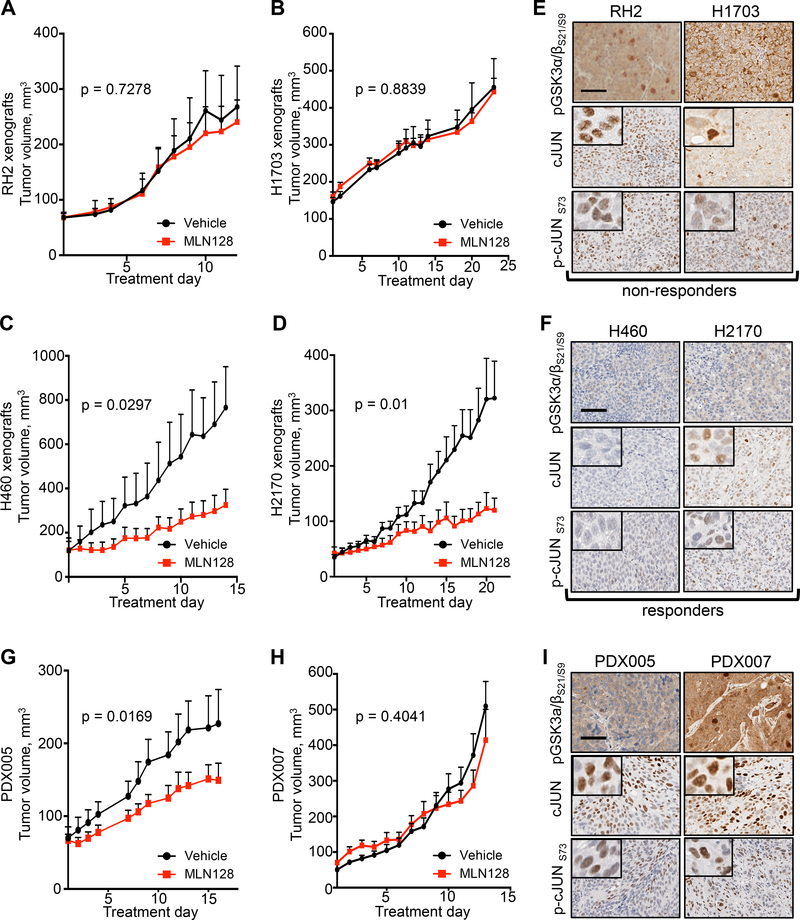
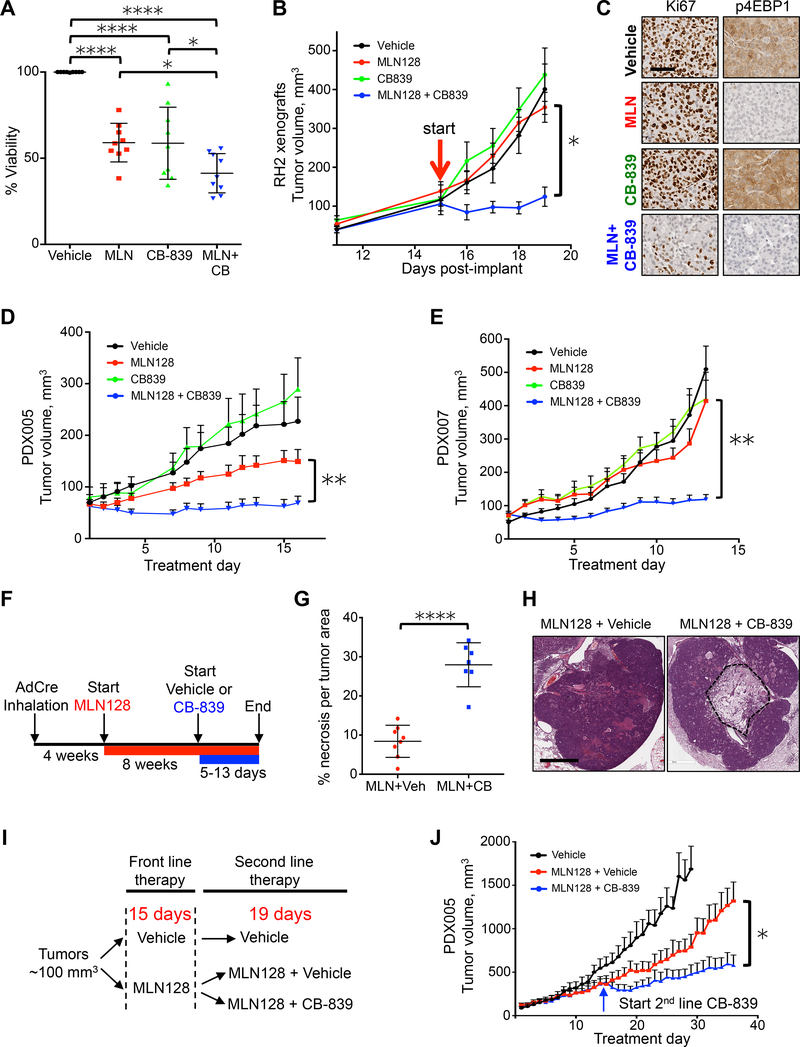
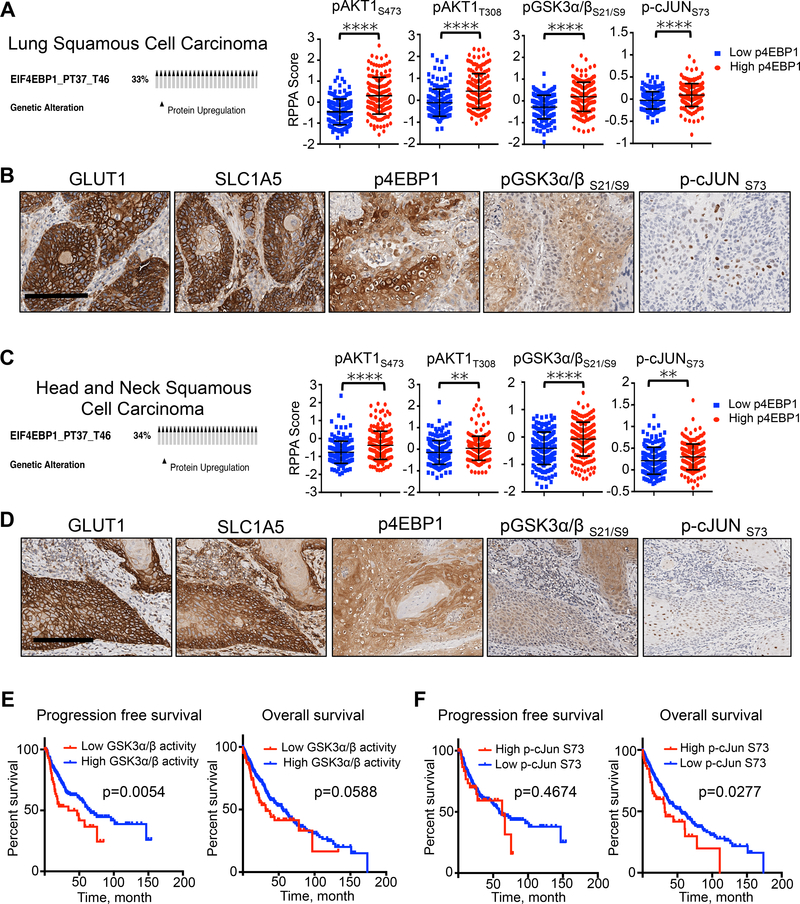
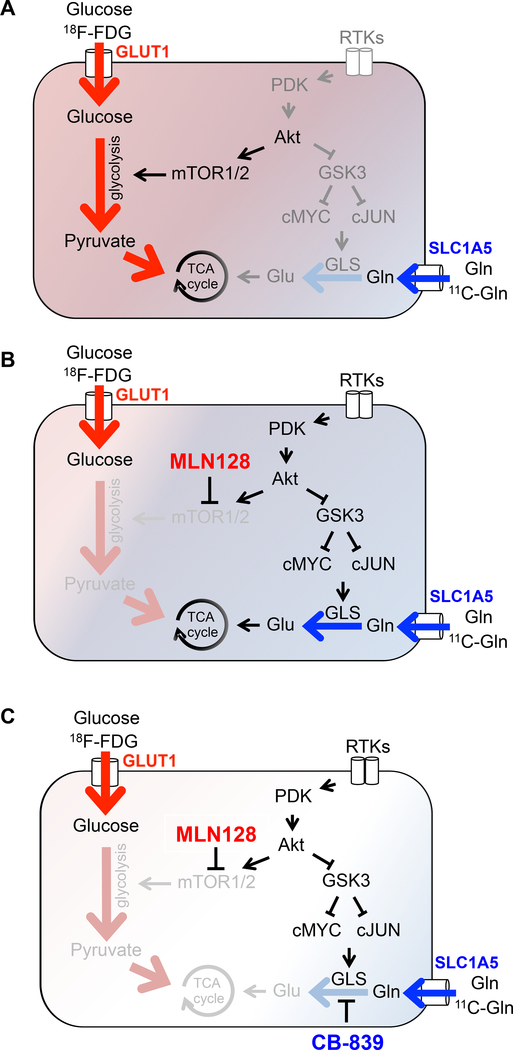
Altered metabolism is a hallmark of cancer growth, forming the conceptual basis for development of metabolic therapies as cancer treatments. We performed in vivo metabolic profiling and molecular analysis of lung squamous cell carcinoma (SCC) to identify metabolic nodes for therapeutic targeting. Lung SCCs adapt to chronic mTOR inhibition and suppression of glycolysis through the GSK3α/β signaling pathway, which upregulates glutaminolysis. Phospho-GSK3α/β protein levels are predictive of response to single-therapy mTOR inhibition while combinatorial treatment with the glutaminase inhibitor CB-839 effectively overcomes therapy resistance. In addition, we identified a conserved metabolic signature in a broad spectrum of hypermetabolic human tumors that may be predictive of patient outcome and response to combined metabolic therapies targeting mTOR and glutaminase.

Keywords: CB-839; GLS; GSK3α/β; PET imaging; glutaminolysis; glycolysis; lung squamous cell carcinoma; mTOR; metabolic signature.


Conflict of interest statement

Declaration of Interests

The authors declare no competing interests.

Figures

Figure 1.
Figure 1.
Chronic MLN128 treatment reduces 18F-FDG uptake, but not tumor cell proliferation in a KL mouse model of SCC. (A) Ki67 mRNA expression in lung ADC (n = 517) and SCC (n = 501) based on TCGA data analysis. The data are represented as the mean ± SD. Statistical significance (****p<0.0001) was calculated using two-tailed t test. (B) Representative IHC staining for CK5/TTF1 (top panel) and Ki67 (bottom panel) in tumors from KL mice. SCC – squamous cell carcinoma, ADC – adenocarcinoma. Scale bar = 200 μm. (C) Quantification of Ki67 staining from tumors in (B); n = 226 (ADC), n = 31 (SCC). (D) 18F-FDG uptake in lung SCC (n = 14) and ADC (n = 22) from KL mice in percent injected dose/gram (% ID/g). (E) Representative GLUT1 staining in lung SCC and ADC tumors from KL mice. Scale bar = 200 μm. (F) Quantification of GLUT1 from tumors in (E); n = 126 (ADC), n = 43 (SCC). (G) Dosing regiment for KL mice treated daily with Vehicle or MLN128 according to indicated scheme. (H) Representative 18F-FDG PET/CT images from KL mice treated with Vehicle or MLN128 for 8 weeks. Tumors are circled with arrow; T = tumor; H = heart. (I) Quantification of 18F-FDG signal (% ID/g) after 8 weeks of treatment; n = 12 (ADC), n = 7 (SCC). (J) Representative CK5/TTF1, Ki67 and p4EBP1 staining of lung SCC tumors from KL mice treated with Vehicle or MLN128 for 8 weeks. Scale bar = 50 μm (K) Quantification of Ki67 staining (left panel; n = 25 (Vehicle), n = 25 (MLN128)) and p4EBP1 staining (right panel; n = 9 (Vehicle), n = 20 (MLN128)) in SCC tumors from (J). (L) Gene set enrichment analysis (GSEA) of genes involved in Core Glycolysis and Pentose Phosphate Pathway from tumors isolated from KL mice treated daily with Vehicle or MLN128 for 8 weeks. NES = normalized enrichment score; FDR q = false discovery rate q-value. The data are represented as the mean ± SEM. Statistical significance (****p<0.0001; ns, not significant) was calculated using two-tailed t test. See also Figure S1.
Figure 2.
Figure 2.
High influx of glucose and glutamine in lung SCC detected by PET imaging. (A) Representative PET and CT images of SCC tumors from KL mice imaged with 18F-FDG and 11C-Glutamine. (B) Image of whole lungs and heart from mouse imaged in (A). Tumor is circled. T = tumor. H = heart. (C) Left lung lobe and tumor from mouse imaged in (A) stained for hematoxylin and eosin (H&E). Magnified image shown in the inset; scale bar = 25 μm. (D) Serial sections of the left lung lobe stained with CK5/TTF1, GLUT1, SLC1A5 from left lobe from mouse imaged in (A). Magnified images shown in the inset; scale bar = 25 μm. (E) PET/CT images of KL mouse with both ADC and SCC tumors imaged with CT (left), 18F-FDG (middle), and 11C-Glutamine (right). H = heart, L = liver. T1 and T2 are outlined with dashed lines (T1 = the blue line, T2 = the red line). (F) PET/CT imaged ADC and SCC lung tumors from (E) were stained with antibodies against CK5/TTF1, GLUT1 and SLC1A5 (left side). Scale bar = 1 mm. Magnified images from T1 (blue box) and T2 (red box) are shown on the right side. Scale bar = 50 μm. See also Figure S2.
Figure 3.
Figure 3.
Lung SCC increase glutaminolysis in vivo following treatment with MLN128. (A) Changes in relative uptake of glucose and glutamine by RH2 cells in response to treatment with 50 nM MLN128 for 72 hr; n = 6 for Vehicle and MLN128. (B) RH2 tumor xenografts stained for GLUT1 and SLC1A5. Scale bar = 50 μm. (C) Dosing and PET imaging regimen for RH2 xenografts treated with Vehicle or MLN128 (D) 18F-FDG uptake measured by % ID/g in RH2 xenografts following treatment as described in (C); n = 7 (Vehicle), n= 17 (MLN128). (E) Representative images from RH2 tumors stained for Ki67 or p4EBP1 from mice treated daily with Vehicle or MLN128 as described in (C). Scale bar = 100 μm. (F) Quantification of Ki67 (left) and p4EBP1 (right) from Vehicle (n = 7) and MLN128 (n = 18) treatment groups. (G) Tumor volumes of RH2 xenografts following treatment with Vehicle (n = 7) or MLN128 (n = 17). (H) Overview of dosing and 13C6-Glucose infusion of RH2 xenografts. (I) Schematic of isotopomer conversion from fully labeled glucose. (J, K, and L) Graphs representing percent M3 labeled lactate (J), M2 labeled citrate (K) and M3 labeled aspartate (L) in RH2 tumors from mice treated with Vehicle (n = 4) or MLN128 (n = 6) and infused with 13C6-Glucose. (M) Overview of dosing and 13C5-Glutamine infusion of RH2 xenografts. (N). Schematic of isotopomer conversion from fully labeled glutamine. (O, P, and Q) Graphs representing percent M5 labeled glutamine (O), M5 labeled glutamate (P) and M4 labeled aspartate (Q) in RH2 tumors from mice treated with Vehicle (n = 5) or MLN128 (n = 6) and infused with 13C5-Glutamine. The data are represented as the mean ± SEM. Statistical significance (*p<0.05; **p<0.01; ***<0.001; ****p<0.0001; ns, not significant) was calculated using two-tailed t test. See also Figure S3.
Figure 4.
Figure 4.
GSK3α/β regulates cMYC and cJUN protein levels and glutaminase activity. (A) Model of GSK3α/β-mediated regulation of glutaminase (GLS). (B) Lung SCC tumor lysates from KL mice treated daily with Vehicle or MLN128 for 8 weeks were immunoblotted with the indicated antibodies. (C) Human SCC/LCC cell lines (RH2 and H460) and ADC cell lines (A549 and H838) were treated with 50 nM or 100 nM MLN128 for 72 hr. Lysates were probed with indicated antibodies. (D) Human cell lines H460 (top) and RH2 (bottom) were treated with increasing doses of GSK3 inhibitor CHIR99021 (GSK3i) for indicated time. Lysates were probed with indicated antibodies. (E) Humans cell lines RH2 and H460 were treated with Vehicle or GSK inhibitor CHIR99021 (GSKi) in the presence of either esiEGFP or increasing doses of esiMyc (top panel) or either siScr or increasing doses of siJun (bottom panel) for 72 hr. Lysates were probed with indicated antibodies. (F and G) Relative uptake of glucose and glutamine in human cell line H460 (F) or RH2 (G) following 72 hr treatment with 10 μM GSKi; n = 6 for Vehicle and GSKi. (H and I) GLS activity measured in H460 (H) and RH2 (I) cells following treatment with Vehicle or 10 μM GSKi for 72 hr; n = 3 for Vehicle and GSKi. The data are represented as the mean ± SEM. Statistical significance (*p<0.05; ****p<0.0001) was calculated using two-tailed t test. See also Figure S4.
Figure 5.
Figure 5.
GSK3α/β phosphorylation state predicts therapeutic response to MLN128 in vivo. (A and B) Tumor volumes for mouse xenografts implanted with human lung SCC cell lines RH2 (A) and H1703 (B) and treated daily with Vehicle (n = 8) or MLN128 (n = 16 (RH2), n = 10 (H1703)). (C and D) Tumor volumes for mouse xenografts implanted with human lung LCC/SCC cell lines H460 (D) and H2170 (E) and treated daily with Vehicle (n = 6 (H460), n = 10 (H2170)) or MLN128 (n = 8 (H460), n = 10 (H2170)). (E) Representative images of RH2 (left) and H1703 (right) xenografts stained with antibodies against pGSK3α/βS21/S9, cJUN or p-cJUNS73. Scale bar = 50 μm. (F) Representative images of H460 (left) and H2170 (right) xenografts stained with antibodies against pGSK3α/βS21/S9, cJUN or p-cJUNS73. Scale bar = 50 μm. (G and H) PDX005 and PDX007 were treated daily with Vehicle (n = 8 (PDX005), n = 9 (PDX007)) or MLN128 (n = 11 (PDX005), n = 9 (PDX007)) for 16 days (PDX005) or 13 days (PDX007). (I) Representative images of PDX005 and PDX007 tumors stained with antibodies against pGSK3α/βS21/S9, cJUN or p-cJUNS73. Scale bar = 50 μm. The tumor volumes are represented as the mean ± SEM. Statistical significance for final tumor volumes was calculated using a two-tailed t test. See also Figure S5.
Figure 6.
Figure 6.
GLS inhibition overcomes resistance to MLN128 in lung SCC tumors. (A) Cell viability of a panel of 9 lung SCC/LCC cell lines (RH2, H460, HCC15, SW900, H1703, H226, H520, H596, H2170) that were treated with Vehicle, 20 nM MLN128 (MLN), 1 μM CB-839 (CB-839) or 20 nM MLN128+1 μM CB-839 (MLN+CB) for 72 hr. n = 3 for each cell line. (B) Tumor volumes of RH2 tumor xenografts treated with Vehicle (black; n = 8), MLN128 (red; n = 8), CB-839 (green; n = 8) or MLN128+CB-839 (blue; n = 8) for 5 days. Start of treatment is indicated with red arrow. (C) Representative images of RH2 tumors treated with Vehicle, MLN128 (MLN), CB-839 or MLN+CB-839 and stained for Ki67 (left) or p4EBP1 (right). Scale bar = 25 μm. (D and E) Tumor volumes of PDX005 (D) and PDX007 (E) treated with Vehicle (black; n = 10 (PDX005), n = 9 (PDX007)), MLN128 (red; n = 11 (PDX005), n = 9 (PDX007)), CB-839 (green; n = 8 (PDX005), n = 9 (PDX007)) or MLN128+CB-839 (blue; n = 13 (PDX005), n = 12 (PDX007)) for 16 days (for PDX005) or 13 days (for PDX007). (F) Overview of delivery of CB-839 as a second line therapy to KL mice treated daily with MLN128 treatment. (G) Percent necrosis per tumor area in KL mice treated with MLN128+vehicle (n = 8) or MLN128+CB-839 (n = 7) (H) Representative H&E slides with necrosis from tumors quantified in (G). Scale bar = 1 mm. (I) Overview of delivery of CB-839 as a second line therapy to PDX005. (J) Tumor volumes for PDX005 treated with Vehicle (black; n = 10) or MLN128 (red; n = 11) or MLN128+CB-839 second line therapy (blue; n = 8). Start of second line therapy is indicated with the blue arrow. The data are represented as the mean ± SEM. Statistical significance (*p<0.05; **p<0.01; ****p<0.0001; ns, not significant) was calculated using a non-parametric one-way ANOVA (Tukey test) for panel (A) and a two-tailed t-test for panels (B, D, E, G, J). Statistical significance for panels B, D, E and J was calculated between final tumor volumes in MLN128 group and MLN+CB839 group. See also Figure S6.
Figure 7.
Figure 7.
Human squamous cell carcinomas of the lung, head and neck share a conserved metabolic signature that is predictive of survival and therapy response to mTOR and GLS inhibition. (A) Oncoprint from TCGA on Lung SCC showing percent of tumors with increased p4EBP1 staining in RPPA data set (left). RPPA data comparing status of indicated proteins in tumors with increased p4EBP1 staining (red; n = 162) to tumors with decreased p4EBP1 staining (blue; n = 166). The data are represented as the mean ± SD. Statistical significance (****p<0.0001) was calculated using two-tailed t test. (B) Representative images from human lung SCC tumors stained with GLUT1, SLC1A5, pGSK3α/βS21/S9, p-cJUNS73. Scale bar = 50 μm. (C) Oncoprint from TCGA on Head and Neck SCC showing 34% of tumors with increased p4EBP1 staining in RPPA data set (left). RPPA data comparing status of indicated proteins in tumors with increased p4EBP1 staining (red; n = 182) to tumors with decreased p4EBP1 staining (blue; n = 175). The data are represented as the mean ± SD. Statistical significance (**p<0.01; ****p<0.0001) was calculated using two-tailed t test. (D) Representative images from human HNSCC tumors stained with GLUT1, SLC1A5, pGSK3α/βS21/S9, p-cJUN S73. Scale bar = 50 μm. (E) Progression free survival (left) and overall survival (right) analysis of Lung SCC patients (TCGA data set) stratified for GSK3α/β activity based on the ratio of pGSK3α/βS21/S9 to total GSK3α/β. Statistical significance was calculated using log-rank test (Mantel-Cox); n = 65 (low GSK3α/β activity) and n = 310 (high GSK3α/β activity). (F) Progression free survival (left) and overall survival (right) analysis of Lung SCC patients (TCGA data set) stratified for p-cJUNS73 levels. Statistical significance was calculated using log-rank test (Mantel-Cox); n = 48 (high p-cJunS73) and n = 448 (low p-cJunS73). See also Figure S7.
Figure 8.
Figure 8.
Model of adaptive glutamine metabolism in lung SCC tumors. (A) Untreated lung SCC tumors. (B) Adaptation following chronic mTOR inhibition with MLN128. (C) Overcoming acquired resistance to MLN128 through GLS inhibition.

Comment in

References

    1. Alexandrov LB, Nik-Zainal S, Wedge DC, Aparicio SA, Behjati S, Biankin AV, Bignell GR, Bolli N, Borg A, Borresen-Dale AL, et al. (2013). Signatures of mutational processes in human cancer. Nature 500, 415–421. - PMC - PubMed
    1. Bankhead P, Loughrey MB, Fernandez JA, Dombrowski Y, McArt DG, Dunne PD, McQuaid S, Gray RT, Murray LJ, Coleman HG, et al. (2017). QuPath: Open source software for digital pathology image analysis. Sci Rep 7, 16878. - PMC - PubMed
    1. Berghmans T, Dusart M, Paesmans M, Hossein-Foucher C, Buvat I, Castaigne C, Scherpereel A, Mascaux C, Moreau M, Roelandts M, et al. (2008). Primary tumor standardized uptake value (SUVmax) measured on fluorodeoxyglucose positron emission tomography (FDG-PET) is of prognostic value for survival in non-small cell lung cancer (NSCLC): a systematic review and meta-analysis (MA) by the European Lung Cancer Working Party for the IASLC Lung Cancer Staging Project. Journal of thoracic oncology : official publication of the International Association for the Study of Lung Cancer 3, 6–12. - PubMed
    1. Brahmer J, Reckamp KL, Baas P, Crino L, Eberhardt WE, Poddubskaya E, Antonia S, Pluzanski A, Vokes EE, Holgado E, et al. (2015). Nivolumab versus Docetaxel in Advanced Squamous-Cell Non-Small-Cell Lung Cancer. N Engl J Med 373, 123–135. - PMC - PubMed
    1. Cancer Genome Atlas Research, N. (2012). Comprehensive genomic characterization of squamous cell lung cancers. Nature 489, 519–525. - PMC - PubMed

Publication types

MeSH terms