

Machine learning algorithms for outcome prediction in (chemo)radiotherapy: An empirical comparison of classifiers
- PMID: 29763967
- PMCID: PMC6095141
- DOI: 10.1002/mp.12967
Machine learning algorithms for outcome prediction in (chemo)radiotherapy: An empirical comparison of classifiers
Erratum in
-
Erratum: "Machine learning algorithms for outcome prediction in (chemo)radiotherapy: An empirical comparison of classifiers" [Med. Phys. 45 (7), 3449-3459 (2018)].Med Phys. 2019 Feb;46(2):1080-1087. doi: 10.1002/mp.13329. Epub 2019 Jan 7. Med Phys. 2019. PMID: 30730570 Free PMC article. No abstract available.
Abstract
Purpose: Machine learning classification algorithms (classifiers) for prediction of treatment response are becoming more popular in radiotherapy literature. General Machine learning literature provides evidence in favor of some classifier families (random forest, support vector machine, gradient boosting) in terms of classification performance. The purpose of this study is to compare such classifiers specifically for (chemo)radiotherapy datasets and to estimate their average discriminative performance for radiation treatment outcome prediction.
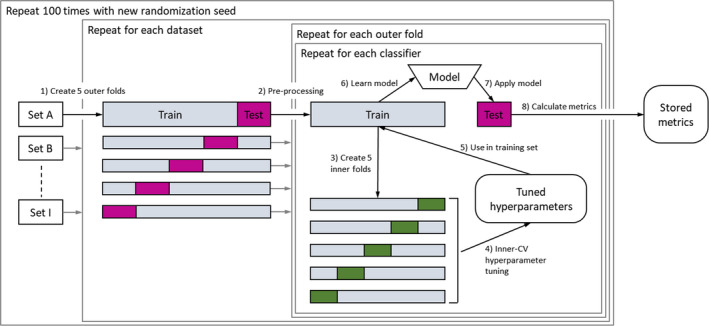
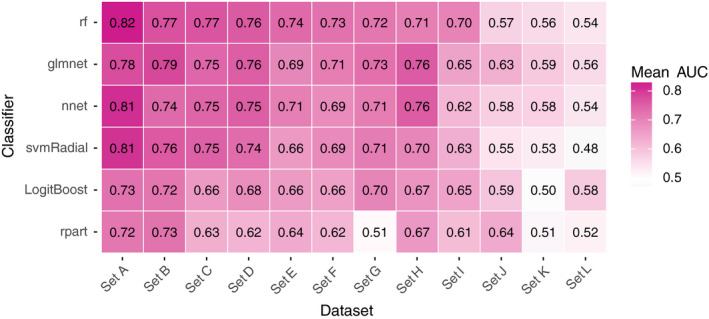
Methods: We collected 12 datasets (3496 patients) from prior studies on post-(chemo)radiotherapy toxicity, survival, or tumor control with clinical, dosimetric, or blood biomarker features from multiple institutions and for different tumor sites, that is, (non-)small-cell lung cancer, head and neck cancer, and meningioma. Six common classification algorithms with built-in feature selection (decision tree, random forest, neural network, support vector machine, elastic net logistic regression, LogitBoost) were applied on each dataset using the popular open-source R package caret. The R code and documentation for the analysis are available online (https://github.com/timodeist/classifier_selection_code). All classifiers were run on each dataset in a 100-repeated nested fivefold cross-validation with hyperparameter tuning. Performance metrics (AUC, calibration slope and intercept, accuracy, Cohen's kappa, and Brier score) were computed. We ranked classifiers by AUC to determine which classifier is likely to also perform well in future studies. We simulated the benefit for potential investigators to select a certain classifier for a new dataset based on our study (pre-selection based on other datasets) or estimating the best classifier for a dataset (set-specific selection based on information from the new dataset) compared with uninformed classifier selection (random selection).
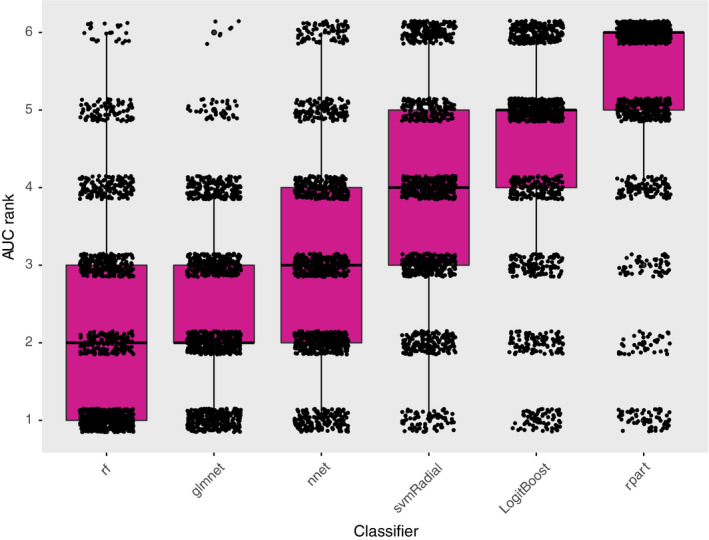
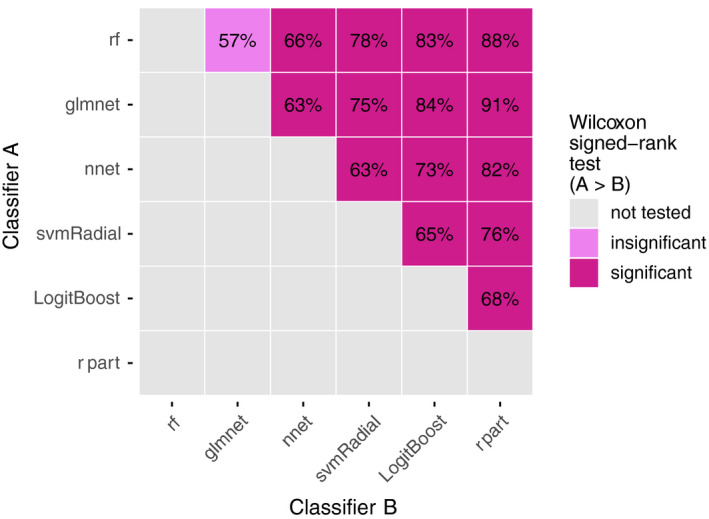
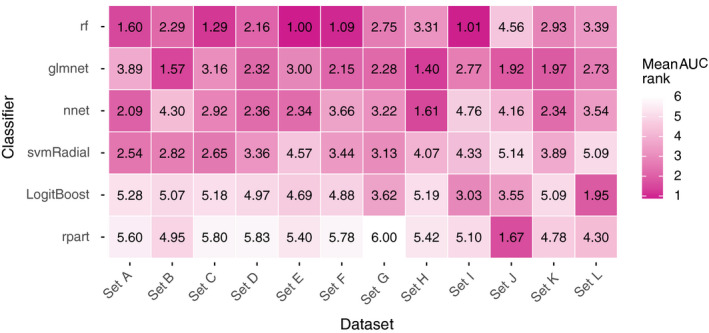
Results: Random forest (best in 6/12 datasets) and elastic net logistic regression (best in 4/12 datasets) showed the overall best discrimination, but there was no single best classifier across datasets. Both classifiers had a median AUC rank of 2. Preselection and set-specific selection yielded a significant average AUC improvement of 0.02 and 0.02 over random selection with an average AUC rank improvement of 0.42 and 0.66, respectively.
Conclusion: Random forest and elastic net logistic regression yield higher discriminative performance in (chemo)radiotherapy outcome and toxicity prediction than other studied classifiers. Thus, one of these two classifiers should be the first choice for investigators when building classification models or to benchmark one's own modeling results against. Our results also show that an informed preselection of classifiers based on existing datasets can improve discrimination over random selection.
Keywords: classification; machine learning; outcome prediction; predictive modeling; radiotherapy.
© 2018 The Authors. Medical Physics published by Wiley Periodicals, Inc. on behalf of American Association of Physicists in Medicine.
Conflict of interest statement
Andre Dekker, Johan van Soest, and Tim Lustberg are founders and shareholders of Medical Data Works B.V., which provides consulting on medical data collection and analysis projects. Cary Oberije is CEO of ptTheragnostic B.V. Philippe Lambin is member of the advisory board of ptTheragnostic B.V.
Figures
Similar articles
-
Can Predictive Modeling Tools Identify Patients at High Risk of Prolonged Opioid Use After ACL Reconstruction?Clin Orthop Relat Res. 2020 Jul;478(7):0-1618. doi: 10.1097/CORR.0000000000001251. Clin Orthop Relat Res. 2020. PMID: 32282466 Free PMC article.
-
Combining handcrafted features with latent variables in machine learning for prediction of radiation-induced lung damage.Med Phys. 2019 May;46(5):2497-2511. doi: 10.1002/mp.13497. Epub 2019 Apr 8. Med Phys. 2019. PMID: 30891794 Free PMC article.
-
Breast cancer prediction with transcriptome profiling using feature selection and machine learning methods.BMC Bioinformatics. 2022 Oct 1;23(1):410. doi: 10.1186/s12859-022-04965-8. BMC Bioinformatics. 2022. PMID: 36183055 Free PMC article.
-
Shallow and deep learning classifiers in medical image analysis.Eur Radiol Exp. 2024 Mar 5;8(1):26. doi: 10.1186/s41747-024-00428-2. Eur Radiol Exp. 2024. PMID: 38438821 Free PMC article. Review.
-
Benchmarking of Machine Learning classifiers on plasma proteomic for COVID-19 severity prediction through interpretable artificial intelligence.Artif Intell Med. 2023 Mar;137:102490. doi: 10.1016/j.artmed.2023.102490. Epub 2023 Jan 18. Artif Intell Med. 2023. PMID: 36868685 Free PMC article. Review.
Cited by
-
Construction of a diagnostic model for osteoarthritis based on transcriptomic immune-related genes.Heliyon. 2023 Dec 13;10(1):e23636. doi: 10.1016/j.heliyon.2023.e23636. eCollection 2024 Jan 15. Heliyon. 2023. PMID: 38187306 Free PMC article.
-
Machine learning for dose-volume histogram based clinical decision-making support system in radiation therapy plans for brain tumors.Clin Transl Radiat Oncol. 2021 Sep 15;31:50-57. doi: 10.1016/j.ctro.2021.09.001. eCollection 2021 Nov. Clin Transl Radiat Oncol. 2021. PMID: 34632117 Free PMC article.
-
Gut Microbiota Characteristics of People with Obesity by Meta-Analysis of Existing Datasets.Nutrients. 2022 Jul 21;14(14):2993. doi: 10.3390/nu14142993. Nutrients. 2022. PMID: 35889949 Free PMC article.
-
Expression patterns and immunological characterization of PANoptosis -related genes in gastric cancer.Front Endocrinol (Lausanne). 2023 Aug 18;14:1222072. doi: 10.3389/fendo.2023.1222072. eCollection 2023. Front Endocrinol (Lausanne). 2023. PMID: 37664853 Free PMC article.
-
Introduction to machine and deep learning for medical physicists.Med Phys. 2020 Jun;47(5):e127-e147. doi: 10.1002/mp.14140. Med Phys. 2020. PMID: 32418339 Free PMC article.
References
-
- Lambin P, Roelofs E, Reymen B, et al. Rapid learning health care in oncology’ – An approach towards decision support systems enabling customised radiotherapy. Radiother Oncol. 2013;109:159–164. - PubMed
-
- Kuhn M, Wing J, Weston S, et al. Caret: Classification and Regression Training; 2016. https://CRAN.R-project.org/package=caret.
-
- Fernández‐Delgado M, Cernadas E, Barro S, Amorim D. Do we need hundreds of classifiers to solve real world classification problems? J Mach Learn Res. 2014;15:3133–3181.
-
- Wainer J. Comparison of 14 different families of classification algorithms on 115 binary datasets. ArXiv160600930 Cs. June 2016. http://arxiv.org/abs/1606.00930. Accessed April 8, 2017.
Publication types
MeSH terms
Grants and funding
LinkOut - more resources
Full Text Sources
Other Literature Sources
Medical
