. 2018 May 15;6(1):89.
doi: 10.1186/s40168-018-0472-x.

Gestational diabetes is associated with change in the gut microbiota composition in third trimester of pregnancy and postpartum

Affiliations

Gestational diabetes is associated with change in the gut microbiota composition in third trimester of pregnancy and postpartum

Mie Korslund Wiinblad Crusell et al. Microbiome. .

Abstract

Background: Imbalances of gut microbiota composition are linked to a range of metabolic perturbations. In the present study, we examined the gut microbiota of women with gestational diabetes mellitus (GDM) and normoglycaemic pregnant women in late pregnancy and about 8 months postpartum.

Methods: Gut microbiota profiles of women with GDM (n = 50) and healthy (n = 157) pregnant women in the third trimester and 8 months postpartum were assessed by 16S rRNA gene amplicon sequencing of the V1-V2 region. Insulin and glucose homeostasis were evaluated by a 75 g 2-h oral glucose tolerance test during and after pregnancy.

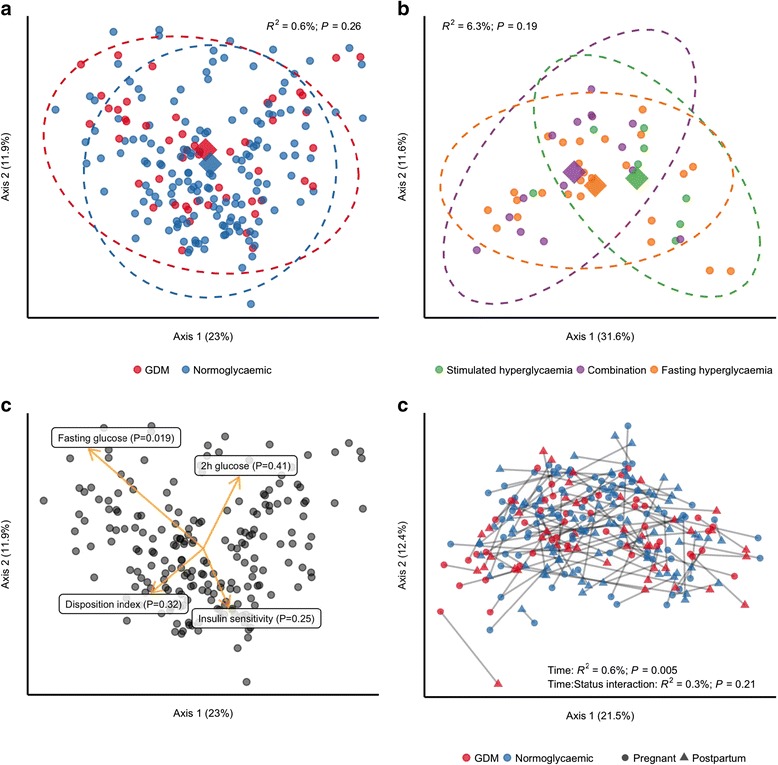
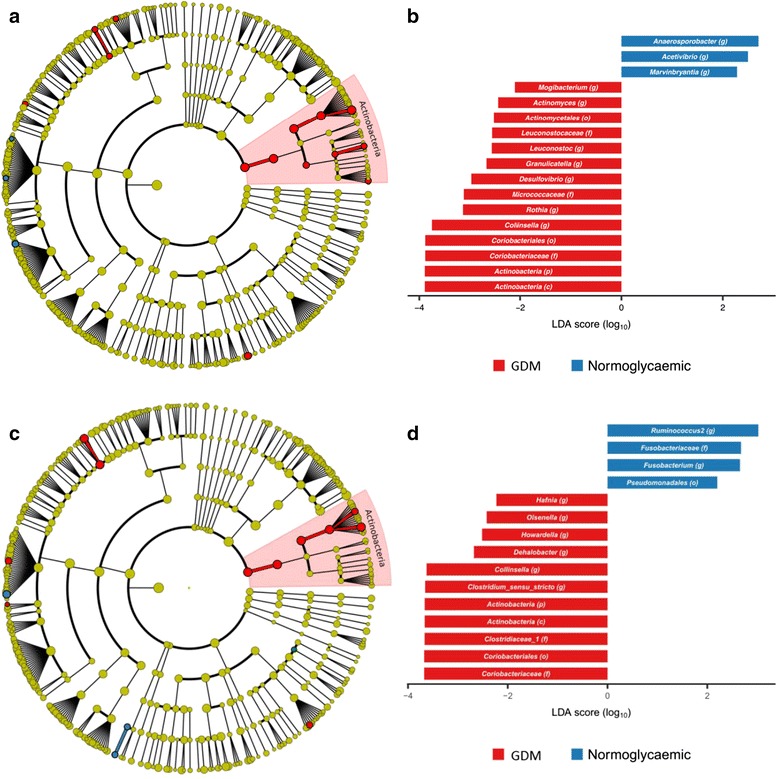
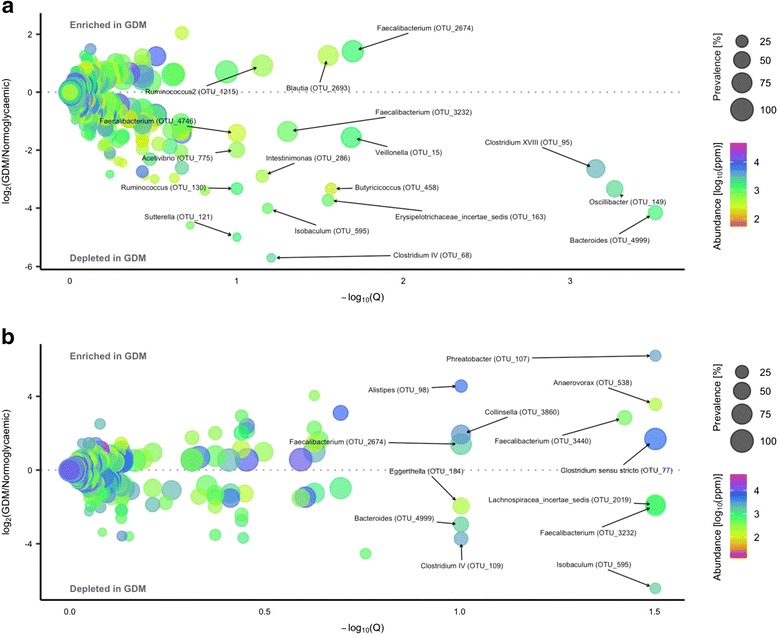
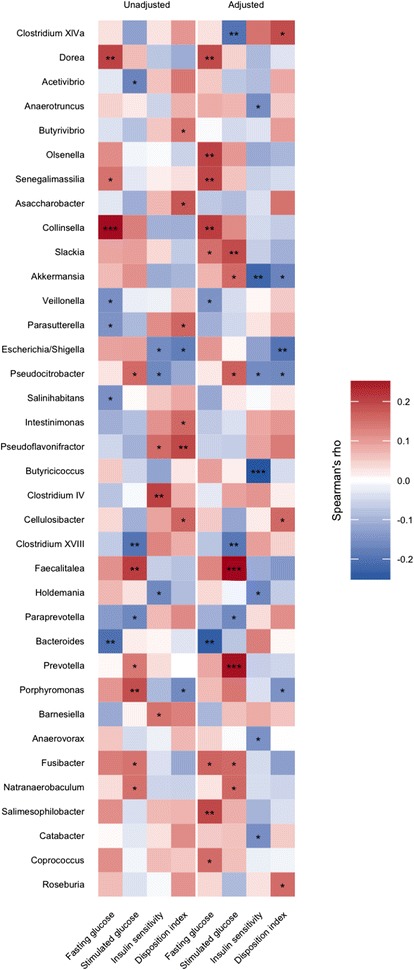
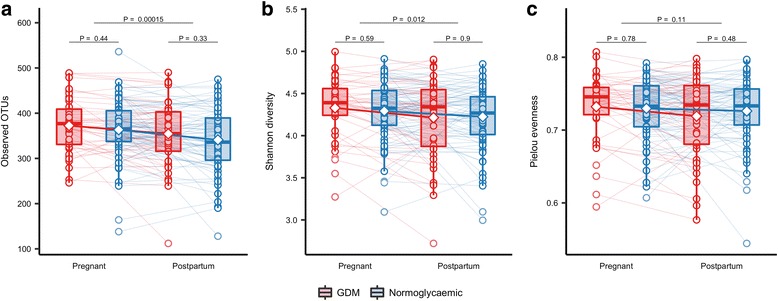
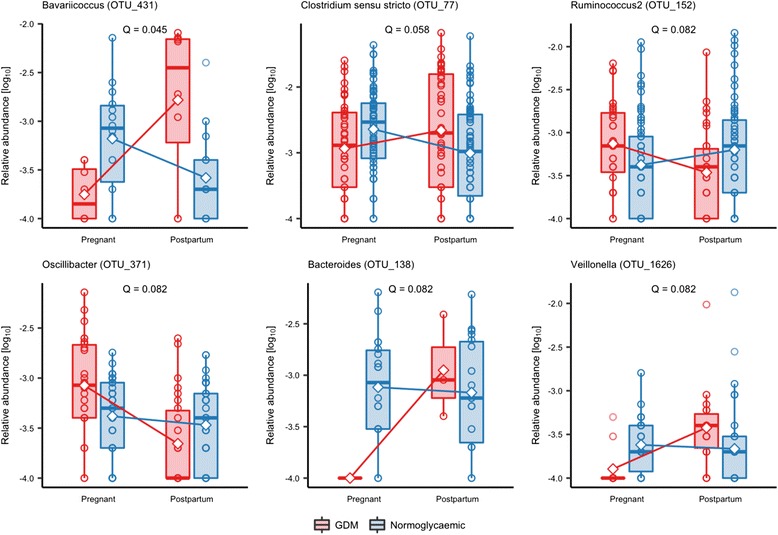
Results: Gut microbiota of women with GDM was aberrant at multiple levels, including phylum and genus levels, compared with normoglycaemic pregnant women. Actinobacteria at phylum level and Collinsella, Rothia and Desulfovibrio at genus level had a higher abundance in the GDM cohort. Difference in abundance of 17 species-level operational taxonomic units (OTUs) during pregnancy was associated with GDM. After adjustment for pre-pregnancy body mass index (BMI), 5 of the 17 OTUs showed differential abundance in the GDM cohort compared with the normoglycaemic pregnant women with enrichment of species annotated to Faecalibacterium and Anaerotruncus and depletion of species annotated to Clostridium (sensu stricto) and to Veillonella. OTUs assigned to Akkermansia were associated with lower insulin sensitivity while Christensenella OTUs were associated with higher fasting plasma glucose concentration. OTU richness and Shannon index decreased from late pregnancy to postpartum regardless of metabolic status. About 8 months after delivery, the microbiota of women with previous GDM was still characterised by an aberrant composition. Thirteen OTUs were differentially abundant in women with previous GDM compared with women with previous normoglycaemic pregnancy.

Conclusion: GDM diagnosed in the third trimester of pregnancy is associated with a disrupted gut microbiota composition compared with normoglycaemic pregnant women, and 8 months after pregnancy, differences in the gut microbiota signatures are still detectable. The gut microbiota composition of women with GDM, both during and after pregnancy, resembles the aberrant microbiota composition reported in non-pregnant individuals with type 2 diabetes and associated intermediary metabolic traits.

Keywords: Bacterial species; Body mass index; Gestational diabetes; Gestational hyperglycaemia; Glycaemic traits; Gut microbiota; Pregnancy.


Conflict of interest statement

Ethics approval and consent to participate

The study was approved by the Ethical Committees of the Capital Region of Denmark (Protocol #H-4-2013-10) and conducted in accordance with the principles of the Declaration of Helsinki II. Written informed consent was obtained from all participants.

Competing interests

The authors declare that they have no competing interests.

Publisher’s Note

Springer Nature remains neutral with regard to jurisdictional claims in published maps and institutional affiliations.

Figures

Fig. 1
Fig. 1
Community structure in women with and without gestational diabetes. For all analyses, samples were rarefied to an equal sequencing depth of 10,000 reads prior to principal coordinate (PCo) ordination based on weighted UniFrac distances. a Samples from pregnant women in the third trimester with (n = 50) or without (n = 157) gestational diabetes. Points are individual samples, and diamonds represent the average ordination scores and ellipses the 95% confidence intervals of a multivariate normal distribution of either group. R2 and P are from the permutational multivariate analysis of variance (PERMANOVA) as implemented in the adonis function of the vegan R package. b Community structure in pregnant women with gestational diabetes diagnosed by fasting hyperglycaemia (n = 25) or stimulated hyperglycaemia (2 h after an oral glucose challenge; n = 8), respectively, or by both (n = 15). Configuration is similar to panel a. c The association between glycaemic traits and community structure during pregnancy regardless of GDM status as determined by PERMANOVA. Vectors representing direction and magnitude of each trait were fitted onto the first and second PCo axes using the envfit function of the vegan R package. d Change in community structure from pregnancy to postpartum. Only samples from women examined at both time points are included (n = 43 and n = 79 for women with and without GDM, respectively). R2 and P are from PERMANOVA testing for a difference in community structure between samples collected during the third trimester and those collected postpartum and for a differential change in community structure in women with GDM compared to women without GDM
Fig. 2
Fig. 2
Taxonomic biomarkers of gestational diabetes during pregnancy and postpartum. Cladogram (a, c) and scores (b, d) of taxonomic biomarkers down to genus level identified by linear discriminant analysis (LDA) using LEfSe during pregnancy (a, b) and postpartum (c, d). Colour indicates the group in which a differentially abundant taxon is enriched (red: GDM and previous GDM; blue: normoglycaemic and previous normoglycaemic pregnancy)
Fig. 3
Fig. 3
Operational taxonomic units differentially abundant during pregnancy and postpartum in women with GDM and normal glucose regulation. Volcano plot of estimated log2 fold difference in operational taxonomic unit (OTU) abundance between women with (n = 50) and without (n = 157) gestational diabetes during pregnancy (a) and postpartum (b) between women with (n = 43) and without (n = 79) previous gestational diabetes and corresponding Benjamini-Hochberg adjusted P values (Q) from negative binomial Wald tests as implemented in the DESeq2 R package. Prevalence indicates the percentage of participants in which a given OTU is present. Abundance indicates mean relative abundance (ppm) of a given OTU during the third trimester and postpartum. Names of OTUs differentially abundant at a 10% false discovery rate are given at the genus level
Fig. 4
Fig. 4
Bacterial genera associated with glycaemic traits during pregnancy regardless of GDM status. Heatmap of correlations (Spearman’s rho) between bacterial genera and fasting plasma glucose, stimulated 2-h glucose, insulin sensitivity and disposition index, with and without adjustment for body mass index. Only taxa nominally associated with either of the four traits are depicted. Taxa are ordered taxonomically. Results for all taxa are presented in Additional file 2: Table S5. *P ≤ 0.05, **P ≤ 0.01, ***P ≤ 0.001
Fig. 5
Fig. 5
Change in alpha diversity from the third trimester to postpartum. Alpha diversity in pregnancy and postpartum as represented by observed richness (a), Shannon diversity (b) and Pielou evenness (c) based on the samples from GDM (n = 43) and normoglycaemic (n = 79) women with available faecal samples from the third trimester and 8 months postpartum. Samples were rarefied to an equal sequencing depth of 10,000 reads. Boxes represent interquartile range (IQR), with the inside line representing the median. Whiskers represent values within 1.5 × IQR of the first and third quartiles. Circles represent individual samples with lines connecting the samples from the same individual. Differences between GDM and normoglycaemic pregnancies within each time point were tested using Student’s t test. Difference in richness, Shannon diversity and Pielou evenness between time points in GDM and normoglycaemic women combined was tested using a mixed linear regression with a random effect of the subject in women with available samples at both time points
Fig. 6
Fig. 6
Operational taxonomic units exhibiting differential change from antepartum to postpartum in gestational diabetes and normoglycaemic women. Based on the samples from GDM (n = 43) and normoglycaemic (n = 79) women with available faecal samples from the third trimester and 8 months postpartum. Samples were rarefied to an equal sequencing depth of 10,000 reads. Boxes represent interquartile range (IQR), with the inside line representing the median. Whiskers represent values within 1.5 × IQR of the first and third quartiles. Circles represent individual samples. Change from the third trimester to 8 months postpartum between GDM and normoglycaemic women was modelled using mixed linear regression ANOVA of the interaction between GDM status and time, and a post hoc t test was used to test the difference in change between GDM and normoglycaemic women. Only the results significant at a false discovery rate of 10% are depicted. A full list of all nominally significant results is available in Additional file 2: Table S5

References

    1. Mor G, Cardenas I. The immune system in pregnancy: a unique complexity. Am J Reprod Immunol N Y N 1989. 2010;63:425–433. - PMC - PubMed
    1. Lain KY, Catalano P. Metabolic changes in pregnancy. Clinical Obstet Gynecol n.d. 2007:938–48. - PubMed
    1. Damm P, Houshmand-Oeregaard A, Kelstrup L, Lauenborg J, Mathiesen ER, Clausen TD. Gestational diabetes mellitus and long-term consequences for mother and offspring: a view from Denmark. Diabetologia. 2016;59:1396–1399. doi: 10.1007/s00125-016-3985-5. - DOI - PubMed
    1. Lowe WL, Scholtens DM, Sandler V, Hayes MG. Genetics of gestational diabetes mellitus and maternal metabolism. Curr Diab Rep. 2016;16:15. doi: 10.1007/s11892-015-0709-z. - DOI - PubMed
    1. Lauenborg J, Hansen T, Jensen DM, Vestergaard H, Mølsted-Pedersen L, Hornnes P, et al. Increasing incidence of diabetes after gestational diabetes. Diabetes Care. 2004;27:1194. doi: 10.2337/diacare.27.5.1194. - DOI - PubMed

Publication types

MeSH terms