. 2018 Jul;30(7):1424-1444.
doi: 10.1105/tpc.18.00177. Epub 2018 May 15.

Rapid and Dynamic Alternative Splicing Impacts the Arabidopsis Cold Response Transcriptome

Affiliations

Rapid and Dynamic Alternative Splicing Impacts the Arabidopsis Cold Response Transcriptome

Cristiane P G Calixto et al. Plant Cell. 2018 Jul.

Abstract

Plants have adapted to tolerate and survive constantly changing environmental conditions by reprogramming gene expression The dynamics of the contribution of alternative splicing (AS) to stress responses are unknown. RNA-sequencing of a time-series of Arabidopsis thaliana plants exposed to cold determines the timing of significant AS changes. This shows a massive and rapid AS response with coincident waves of transcriptional and AS activity occurring in the first few hours of temperature reduction and further AS throughout the cold. In particular, hundreds of genes showed changes in expression due to rapidly occurring AS in response to cold ("early AS" genes); these included numerous novel cold-responsive transcription factors and splicing factors/RNA binding proteins regulated only by AS. The speed and sensitivity to small temperature changes of AS of some of these genes suggest that fine-tuning expression via AS pathways contributes to the thermo-plasticity of expression. Four early AS splicing regulatory genes have been shown previously to be required for freezing tolerance and acclimation; we provide evidence of a fifth gene, U2B"-LIKE Such factors likely drive cascades of AS of downstream genes that, alongside transcription, modulate transcriptome reprogramming that together govern the physiological and survival responses of plants to low temperature.


Figures

Figure 1.
Figure 1.
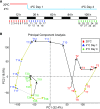
Analyses of the Arabidopsis Response to Low Temperature in Diel Conditions. (A) Schematic representation of sampling strategy. Time points of sampling are marked by vertical colored lines and labeled from 1 to 26. Five-week-old Arabidopsis rosettes were harvested every 3 h over a 24-h period at 20°C (vertical red lines). At dusk, the temperature was gradually reduced to 4°C, and harvesting continued during the first day at 4°C (vertical blue lines) and the fourth day at 4°C (vertical green lines). Black boxes, 12 h dark; white boxes, 12 h light. (B) Principal component analysis of the Arabidopsis rosette transcriptome before and after a shift from 20°C to 4°C. Each data point (T1–T26) refers to one time point and represents the average gene expression (n = 3) from the RNA-seq data. The data points are connected by arrows in chronological order: black for 3 h of dark and yellow for 3 h of light. The dotted gray line joining T17 and T18 represents days 2 and 3 at 4°C.
Figure 2.
Figure 2.
DE and DAS Analyses of Arabidopsis Response to Low Temperature. (A) Flow chart showing the distribution of the 8949 DE (blue) and DAS (red) genes (Supplemental Data Set 1). The DE and DAS gene sets are largely different with only 795 (11.26%) in common (overlap between blue and red circles in [B]). (B) Euler diagram of DE (left) and DAS (right) genes identified here and compared with known cold response DE/DAS genes (dashed circle). Information on known cold response DE/DAS genes can be found in Supplemental Data Sets 3 and 4, respectively. (C) Most significantly enriched GO terms for DE (shades of blue) and DAS (shades of red) genes. Bar plots of -log10 transformed FDR values are shown. BP, biological process; MF, molecular function; CC, cellular component. (D) Number and percentage of DE genes that are significantly DE in both day 1 and day 4 at 4°C and unique to day 1 and day 4. (E) Number and percentage of DAS genes that are significantly DAS in both day 1 and day 4 at 4°C and unique to day 1 and day 4.
Figure 3.
Figure 3.
Expression Profiles of CBFs, Selected COR Genes, and Known Cold Response Genes. (A) Single-exon and single-transcript CBF genes. (B) Total gene expression level of three COR regulatory genes: COR78 and single-transcript genes KIN1 and COR47. (C) Expression of gene and protein-coding transcripts of RCF1 (AT1G20920). The P1, P3, P4, P5, P6, and P7 transcript isoforms of RCF1 differ at their 3′UTR sequences. (D) PIF7 (AT5G61270) has protein-coding P1 and intron-retained P2 as main expressed transcripts. (E) The novel DAS gene PHYB (AT2G18790) has two main transcripts, protein-coding P1 and intron-retained JS1. (F) The novel DAS gene SUF4 (AT1G30970) has two main transcripts, protein-coding P1 and intron-retained s2. (C) to (F) Rapid and significant isoform switches detected by TSIS (Guo et al., 2017) are labeled with red circles. For clarity, transcripts whose expression was below 4 TPM at all time points were not included in the graphs. Error bars indicate se of the mean, n = 3 biological replicates × 3 sequencing replicates.
Figure 4.
Figure 4.
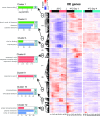
Hierarchical Clustering and Heat Map of Arabidopsis DE Cold-Responsive Genes and Key GO Terms. DE genes show segregation into 12 coexpressed modules. For simplicity, genes that do not fall into any cluster have been removed from the heat map (n = 492). Cluster 3 (n = 762) includes genes enriched for “structural constituent of ribosome” and is upregulated mostly in the fourth day at 4°C. Cluster 9 (n = 1140) includes genes enriched for “response to auxin” and is downregulated upon cold, whereas cluster 12 (n = 571) includes genes enriched for “plasma membrane” and is upregulated within the first 3 h of cold treatment. Full results of GO enrichment analysis of heat map DE clusters are shown in Supplemental Data Set 7. The z-score scale represents mean-subtracted regularized log-transformed TPMs. BP (red bars), biological process; CC (blue bars), cellular component; MF (green bars), molecular function. The colored bars above the heat map indicate whether samples were exposed to light (colored) or dark (black) in the 3 h before sampling.
Figure 5.
Figure 5.
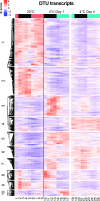
Heat Map of DTU Transcripts from DAS Genes. DTU transcripts from DAS genes show segregation into 10 coexpressed clusters. For simplicity, transcripts that do not fall into any cluster have been removed from the heat map (n = 36). Clusters 1 and 2 show transcripts downregulated upon cold. Clusters 3, 5, and 10 show clear transient changes in AS isoform transcripts at different times during day 1 at 4°C, while cluster 4 (n = 326) shows late upregulation of transcripts on the fourth day at 4°C. Clear gain in rhythmic expression of AS transcripts upon cold is seen in cluster 7 (n = 258). Cluster 8 (n = 233) includes transcripts with increased expression within the first 3 h of cold treatment. The z-score scale represents mean-subtracted regularized log-transformed TPMs. The colored bars above the heat map indicate whether samples were exposed to light (colored) or dark (black) in the 3 h before sampling.
Figure 6.
Figure 6.
Rapid Changes in DE and DAS Genes in Response to Cold. Histograms and density plots of the time points at which the 7302 DE (A) and 2442 DAS (B) genes first become significantly different in day 1 and day 4 at 4°C compared with 20°C. The genes that first show significant differences after longer exposure to cold (day 4 at 4°C) represent 20.45% of DE and 14.73% of DAS genes. Each gene is represented only once in each histogram (left y axis). The estimated density line of the number of genes illustrates the early waves of transcriptional and alternative splicing responses (right y axis).
Figure 7.
Figure 7.
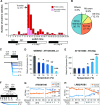
Sensitivity of AS to Low Temperatures. (A) Frequency over time of isoform switches in the RNA-seq time course. Each isoform switch involved “abundant” transcripts (i.e., expression of each transcript makes up at least 20% of the total expression of the gene in at least one time point). Proportion of protein-coding transcripts is also shown and represents either production of different protein-coding isoforms or transcripts encoding the same protein where key AS events are in the UTR region. Data between T17 and T18 represent ISs that occurred between day 1 and day 4. (B) Proportion of the major types of AS events involved in isoform switches in (A) was measured with SUPPA (Alamancos et al., 2015). (C) Experimental design for assessing long-term changes in AS induced by small reductions in temperature initiated at dusk. Sampling of 5-week-old Arabidopsis rosettes occurred at dawn, after 12 h of temperature reduction, and is marked by a vertical arrow. (D) AS of novel cold response gene GEMIN2 (PTC-containing transcript AT1G54380_c3) is sensitive to reductions in temperature of 2°C. (E) Exon 9 skipping (E9.Skip) of novel cold response gene AT1G15200 (transcripts AT1G15200.1, AT1G15200_JS1, and AT1G15200_JS2) is sensitive to reductions in temperature of 8°C. (F) Experimental design for assessing immediate changes in AS induced by gradual reductions in temperature initiated at dusk. Sampling of rosettes of 5-week-old Arabidopsis plants occurred at the indicated time points after dusk and is marked by vertical arrows. (G) AS of novel cold response gene AT5G67540 (transcripts AT5G67540_P1, AT5G67540_P2, and AT5G67540_s1) is affected within 1 h of gradual reduction in temperature. (H) AS of novel cold response gene LIGHT-RESPONSE BTB2 (LRB2/POB1; transcripts AT3G61600_P1 and AT3G61600_P2) is affected within 1 h of gradual reduction in temperature. In (D), (E), (G), and (H), Tukey t tests were performed to compare each temperature reduction result against the 20°C control. Significant differences are labeled with asterisks (*P < 0.05, **P < 0.01, and ***P < 0.001). Error bars indicate sd, n = 3 biological replicates.
Figure 8.
Figure 8.
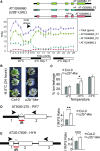
AT1G06960 (U2B”-LIKE) Expression Profile and Assays of the Knockout Line. (A) Structures of highly expressed U2B”-LIKE transcripts (black boxes, UTR; color-coded boxes, exon coding sequence) and gene/transcript expression profile across the time course. I4R, Intron 4 Retention; Alt5′ss, alternative 5′ splice site. Black/white bars below expression plots represent 12-h dark/light cycles. (B) Freezing sensitivity of cold-acclimated Col-0 and u2b”-like mutants showing recovery of wild-type and nonrecovery of u2b”-like mutant plants at −8.5°C. (C) Cellular ion leakage in Col-0 (wild-type) and u2b”-like (knock-out mutant) leaf discs subjected to different freezing temperatures before thawing (n = 4). Transformed ion leakage data were used in a one-tailed t test, which confirmed u2b”-like loses more electrolytes than wild-type Col-0 at −10°C (*P = 0.0263). Each bar of the plot represents average ion leakage values. In (B) and (C), plants were grown at 20°C for 4 to 5 weeks and cold acclimated at 5°C for 2 weeks before the freezing assay. (D) and (E) Relevant regions of gene structures (left) and HR RT-PCR data (right) of plants harvested at dawn of 4°C day 1 are shown (n = 3). AS isoform levels obtained with HR RT-PCR analysis are shown relative to the fully spliced (FS) isoform (AS/FS ratio). The data were compared using a two-way ANOVA. (D) Relative levels of PTC-containing intron 1 of the PIF7 (AT5G61270) gene is increased in u2b”-like mutant transcripts when compared with Col-0 (**P = 0.002). (E) Transcription factor HY5 homolog (HYH; AT3G17609). The AS ratio of the PTC-containing I1R transcript shows a highly significant increase in the u2b’’-like mutant compared with Col-0 (***P = 0.001). Significant changes in the AS ratio of the above genes in the u2b’’-like mutant is evidence that the U2B’’-LIKE might be involved in regulating their AS. Black arrows represent the location on the gene of the forward and reverse primers used for HR RT-PCR. IR, intron retention. More data are in Supplemental Data Set 14. In (A) and (C), error bars are se of the mean (n = 3 biological replicates × 3 sequencing replicates in [A], and n = 4 biological replicates × 6 pseudo-replicates in [C]), whereas in (D) and (E), they represent sd (n = 3 biological replicates).
Figure 9.
Figure 9.
Model for the Cold Signaling Pathway and Its Regulation of Genome-Wide Gene Expression. Cooling activates Ca2+-dependent kinases and MAP kinases that activate or repress transcription factors or splicing factors. These in turn regulate the transcription or AS of downstream genes including other TFs and SFs, thereby driving cascades of cold-induced gene expression.
None

Comment in

References

    1. Adrian J., et al. (2015). Transcriptome dynamics of the stomatal lineage: birth, amplification, and termination of a self-renewing population. Dev. Cell 33: 107–118. - PMC - PubMed
    1. Alamancos G.P., Pagès A., Trincado J.L., Bellora N., Eyras E. (2015). Leveraging transcript quantification for fast computation of alternative splicing profiles. RNA 21: 1521–1531. - PMC - PubMed
    1. Amorim M.F., Willing E.-M., Szabo E.X., Droste-Borel I., Macek B., Schneeberger K., Laubinger S. (2017). Arabidopsis U1 snRNP subunit LUC7 functions in alternative splicing and preferential removal of terminal introns. bioRxiv doi/10.1101/150805.
    1. Barrero-Gil J., Salinas J. (2013). Post-translational regulation of cold acclimation response. Plant Sci. 205-206: 48–54. - PubMed
    1. Barta A., Marquez Y., Brown J.W.S. (2012). Challenges in Plant Alternative Splicing. In Alternative pre-mRNA Splicing: Theory and Protocols, Stamm S., Smith C.W.J., Lührmann R., eds (Weinheim, Germany: Wiley-VCH Verlag; ), pp. 79–91.

Publication types

MeSH terms