. 2018 May 15;9(1):1900.
doi: 10.1038/s41467-018-04234-4.

B cell activation and plasma cell differentiation are inhibited by de novo DNA methylation

Affiliations

B cell activation and plasma cell differentiation are inhibited by de novo DNA methylation

Benjamin G Barwick et al. Nat Commun. .

Abstract

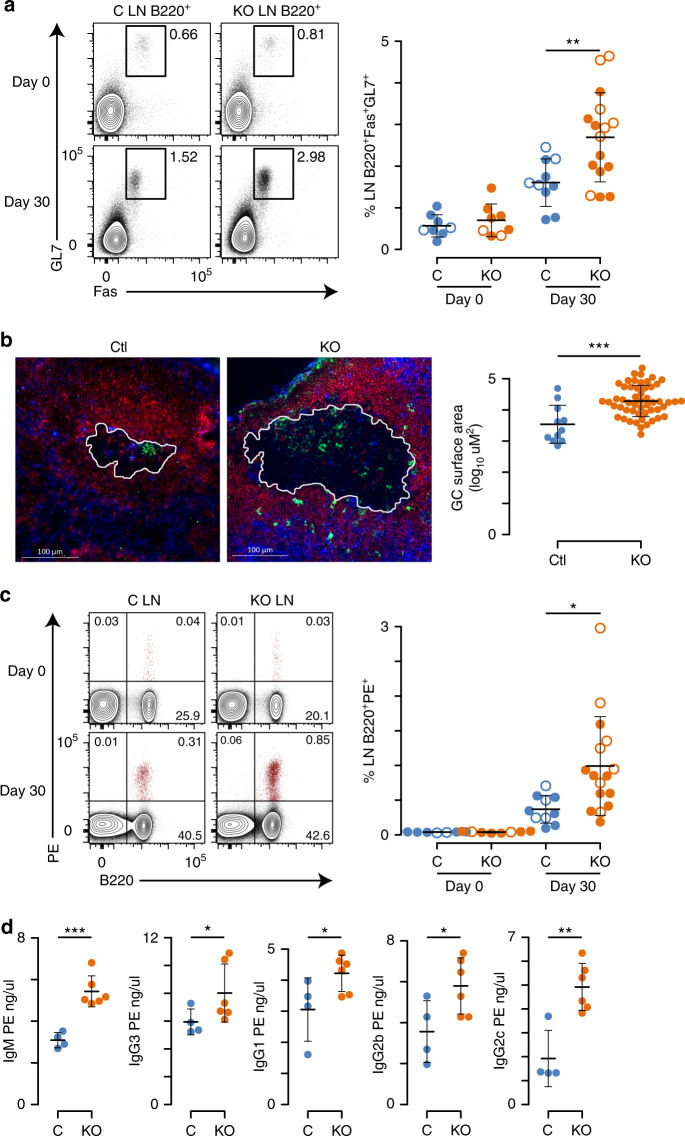
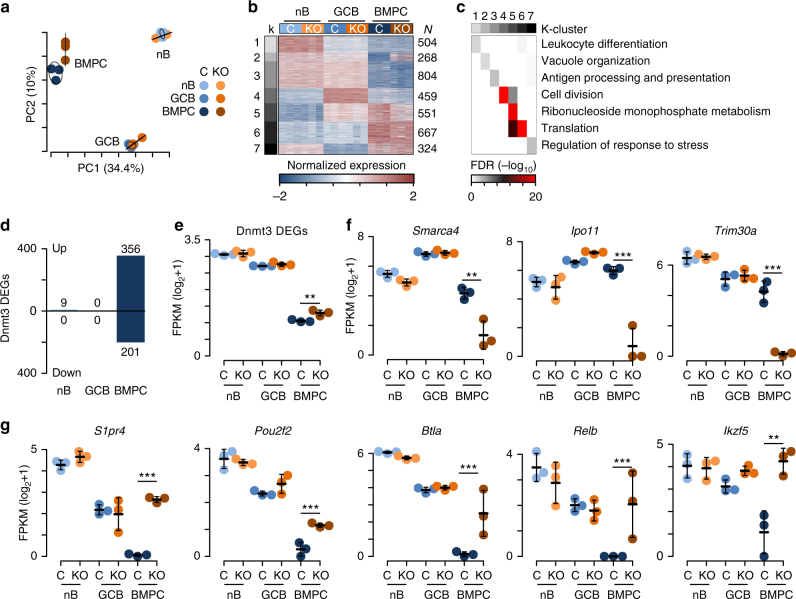
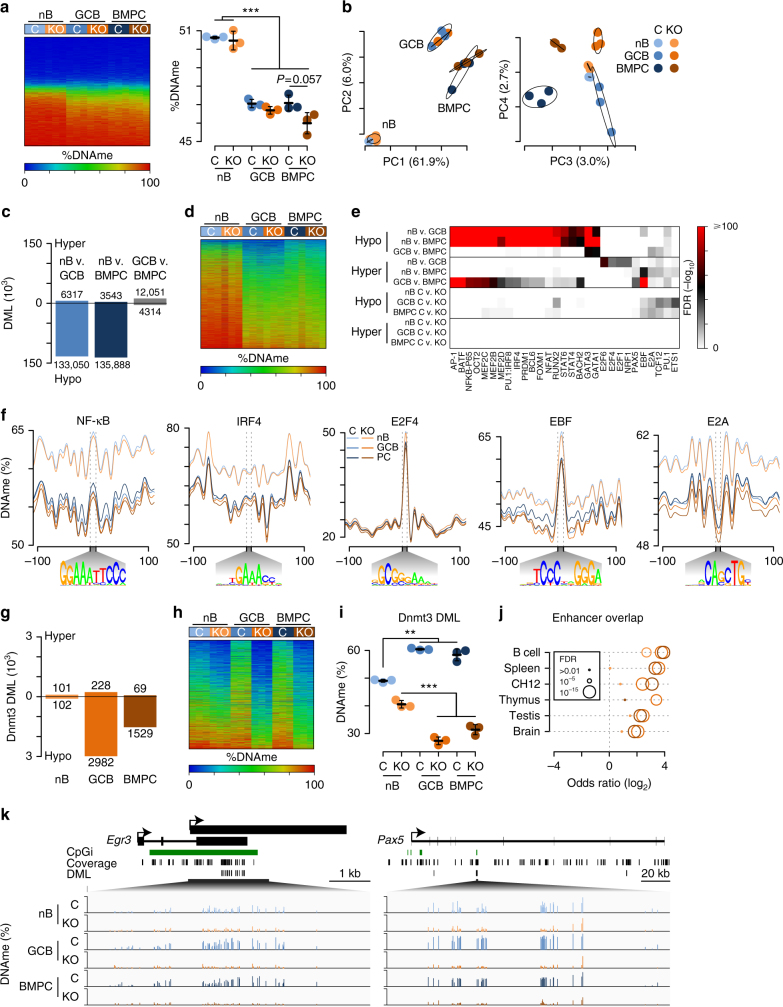
B cells provide humoral immunity by differentiating into antibody-secreting plasma cells, a process that requires cellular division and is linked to DNA hypomethylation. Conversely, little is known about how de novo deposition of DNA methylation affects B cell fate and function. Here we show that genetic deletion of the de novo DNA methyltransferases Dnmt3a and Dnmt3b (Dnmt3-deficient) in mouse B cells results in normal B cell development and maturation, but increased cell activation and expansion of the germinal center B cell and plasma cell populations upon immunization. Gene expression is mostly unaltered in naive and germinal center B cells, but dysregulated in Dnmt3-deficient plasma cells. Differences in gene expression are proximal to Dnmt3-dependent DNA methylation and chromatin changes, both of which coincide with E2A and PU.1-IRF composite-binding motifs. Thus, de novo DNA methylation limits B cell activation, represses the plasma cell chromatin state, and regulates plasma cell differentiation.


Conflict of interest statement

The authors declare no competing interests.

Figures

Fig. 1
Fig. 1
Increased germinal center B cell expansion in Dnmt3-deficient mice. a Germinal centers identified using Fas and GL7 expression on inguinal and periaortic lymph node (LN) B220+ B cells in naive mice (day 0) and PE-CFA immunized mice (day 30) in Cd19cre/+Dnmt3afl/flDnmt3bfl/fl mice (KO) and littermate controls (C). b Immunofluorescence of lymph nodes 30 days after PE-CFA immunization showing T cells (blue; Thy1.2), IgD B cells (red; IgD), and activated B cells (green; GL7). The germinal center area is outlined in white and a 100 μM scale is shown (bottom left). Quantitation of germinal center area is shown (right). c B220 expression and PE-binding of LN lymphocytes from naive mice (day 0) and PE-CFA immunized mice (day 30). Flow cytometry data are lymphocyte size gated and CD11b. d Serum PE-specific antibodies for C and KO mice 30 days post-immunization. Mean and standard deviation shown on beeswarm plots and P values are calculated using a two-sided t-test (*P < 0.05, **P < 0.01, ***P < 0.001). Data are from either two, day 0 experiments with eight mice each and two, day 30 experiments with 9 mice and 17 mice (a, c) or from one, day 30 experiment with 10 mice (b, d), where open circles represent females and closed circles males and no sex differences were observed in multivariate analysis
Fig. 2
Fig. 2
Cell autonomous control of B cell proliferation and differentiation. a B220 expression and PE binding of control (C) (CD45.1+CD45.2+ Dnmt3afl/+Dnmt3bfl/+) and KO (CD45.2+ Cd19cre/+Dnmt3afl/flDnmt3bfl/fl) cells in the inguinal and periaortic lymph nodes (LN) 30 days after PE-CFA challenge. b Fas and GL7 expression on B220+PE+ LN cells in a. c CD138 and B220 expression on C and KO cells in the spleen (Spl; top) and bone marrow (BM; bottom) of chimeric mice. All data are lymphocyte size gated and CD11bCD11cF4/80Thy1.2. P values are calculated using a paired t-test. Data represent two experiments with four and five mice per experiment with four male and five female mice
Fig. 3
Fig. 3
Dysregulation of plasma cell gene expression without Dnmt3a and Dnmt3b. a Principle component analysis of gene expression. The percentage in parenthesis is the proportion of variation explained by each component and 95% confidence intervals for each group are drawn. b K-means clustering of differentially expressed genes organized into seven categories uniquely. Samples are represented by columns and genes by rows. c Gene ontology analysis of genes contained in the K-clusters from b. Select ontologies are shown, and the significance of each ontology in each K-cluster (represented by columns) is denoted by color. d Number of Dnmt3-specific differentially expressed genes (DEGs) found between Dnmt3-sufficient and -deficient naive B cells (nB), germinal center B cells (GCB), and bone marrow plasma cells (BMPC). Genes upregulated in Dnmt3-deficient cells are shown above and those downregulated are shown below. e Average level of expression of all Dnmt3-specific differentially expressed genes shown in d. (f, g) Examples of Dnmt3 differentially expressed genes both downregulated (f) and upregulated (g) in Dnmt3-deficient BMPC. **FDR ≤ 0.01, ***FDR ≤ 0.001; mean and standard defviation are shown f, g. Data are from 3 experiments and 24 mice where nB were isolated from 6 mice, GCB were from 12 mice (2 mice were pooled per sample), and BMPC were from 6 mice. Each cell type contained 4 female and 2 male (nB, GCB) or 4 male and 2 female (BMPC) mice split evenly between the genotypes. Differentially expressed genes had an FDR ≤ 0.01 and a fold change ≥ 2
Fig. 4
Fig. 4
De novo DNA methylation during B cell differentiation. a Heat map of DNA methylation (DNAme) in lymph node B220+GL7Fas naive B cells (nB), B220+PE+GL7+Fas+ germinal center B cells (GCB), and CD138+ bone marrow plasma cells (BMPC) in Dnmt3-sufficient (Dnmt3afl/flDnmt3bfl/fl; C) and -deficient (Cd19cre/+Dnmt3afl/flDnmt3bfl/fl; KO) mice (left) and average DNA methylation (right). b Principle components analysis of DNAme. The percentage in parenthesis is the proportion of variation explained by each component. c Number of differentially methylated loci (DML) between nB, GC, and BMPC cell types. d Heat map of all DML identified in c. e Analysis of motifs enriched within 50 bp of DML. The false discovery rate (FDR) significance is denoted by color (key right) and a full list can be found in Supplementary Data 6. f Plot of DNA methylation levels proximal to all genomic binding motifs for the indicated factors. g Number of DML between Dnmt3-deficient mice in nB, GCB, and BMPC relative to Dnmt3-sufficient cell types. h Heat map of loci identified in g. i Average DNA methylation for all loci determined in f. j Overlap of Dnmt3 DML with H3K4me1+H3K27ac+ enhancers in the designated cell types (light orange: nB; orange: GCB, brown: BMPC). k Examples of differentially methylated loci between Dnmt3-sufficient and Dnmt3-deficient cells. Scale is from 0 to 100% DNAme. **P ≤ 0.01, ***P ≤ 0.001, Student's two-sided t-test. Data were derived from 3 experiments and 24 mice, where nB were isolated from 6 mice, GCB were from 12 mice (2 mice were pooled per sample), and BMPC were from 6 mice. Each cell type contained four female and two male (nB, GCB) or four male and two female (BMPC) mice split evenly between the genotypes
Fig. 5
Fig. 5
Increased chromatin accessibility in Dnmt3-deficient CD138+ BMPC. a K-means clustering of differential ATAC-seq peaks in B220+GL7Fas naive B cells (nB), B220+PE+GL7+Fas+ PE-specific germinal center B cells (GCB), and CD138+ BMPC in Cd19cre/+Dnmt3afl/flDnmt3bfl/fl (KO) and littermate control (C) mice. The number of peaks in each cluster is denoted on the right. b Enrichment of HOMER transcription factor binding motifs in different K-means clusters shown in a. c Accessibility footprinting of ATAC-seq data shown for all PU.1, OCT-2, and E2A binding motifs genome-wide. Motifs are shown below. d Accessibility footprinting at E2A (top) and IRF4 (bottom) binding motifs that fall in specific K-means regions. e Number of differentially accessible regions (DARs) between Dnmt3-deficient (KO) and -sufficient (C) mice for nB, GCB, and BMPC. f Genome plot of regions containing differentially accessible regions (DARs) around Grb7. E2A transcription factor bind motifs are shown below. Data were derived from 3 experiments and 22 mice, where nB were isolated from 5 mice, GCB were from 12 mice (2 mice were pooled per sample), and BMPC were from 5 mice. Mice were either all male (nB), 4 female and 2 male split between the genotypes (GCB), or all female (BMPC)
Fig. 6
Fig. 6
De novo DNA methylation accompanies gene repression in BMPC. a Average DNA methylation (DNAme) relative to the transcription start site (TSS) and transcription termination site (TTS) of genes stratified by expression level in lymph node B220+GL7Fas naive B cells (nB; top), B220+PE+GL7+Fas+ germinal center B cells (GCB; middle), and CD138+ BMPC (bottom) for both Cd19cre/+Dnmt3afl/flDnmt3bfl/fl (KO; orange) and littermate control (C; blue). b Average ATAC-seq accessibility measured at Dnmt3-dependent differentially methylated CpGs. c Average gene expression and DNAme at Dnmt3-specific differentially expressed genes (N = 90) with proximal differentially methylated loci (N = 210). d Scatterplot of accessibility change by DNA methylation change for Dnmt3 differentially methylated loci (left), and differentially expressed genes and methylated loci from c in BMPC. Spearman's correlation coefficient (ρ) and significance of correlation are shown. e Examples of differentially expressed genes and methylated loci at the Pou2f2 and Il10ra loci are shown. A schematic of the gene is shown (top) with examples of gene expression and DNA methylation changes shown below. The carrot (^) denotes the CpG shown below. Data are from 5 experiments and 36 mice as described (Figs. 3–5). Mean (a, c, d, e) and standard deviation are shown (b, e)

References

    1. Nutt SL, Hodgkin PD, Tarlinton DM, Corcoran LM. The generation of antibody-secreting plasma cells. Nat. Rev. Immunol. 2015;15:160–171. doi: 10.1038/nri3795. - DOI - PubMed
    1. Hodgkin PD, Lee JH, Lyons aB. B cell differentiation and isotype switching is related to division cycle number. J. Exp. Med. 1996;184:277–281. doi: 10.1084/jem.184.1.277. - DOI - PMC - PubMed
    1. Hasbold J, Corcoran LM, Tarlinton DM, Tangye SG, Hodgkin PD. Evidence from the generation of immunoglobulin G–secreting cells that stochastic mechanisms regulate lymphocyte differentiation. Nat. Immunol. 2004;5:55–63. doi: 10.1038/ni1016. - DOI - PubMed
    1. Taylor JJ, Pape KA, Steach HR, Jenkins MK. Apoptosis and antigen affinity limit effector cell differentiation of a single naïve B cell. Science. 2015;347:784–787. doi: 10.1126/science.aaa1342. - DOI - PMC - PubMed
    1. Shi W, et al. Transcriptional profiling of mouse B cell terminal differentiation defines a signature for antibody-secreting plasma cells. Nat. Immunol. 2015;16:663–673. doi: 10.1038/ni.3154. - DOI - PubMed

Publication types

MeSH terms