. 2018 May 15;9(1):1921.
doi: 10.1038/s41467-018-04310-9.

Comprehensive epigenetic landscape of rheumatoid arthritis fibroblast-like synoviocytes

Affiliations

Comprehensive epigenetic landscape of rheumatoid arthritis fibroblast-like synoviocytes

Rizi Ai et al. Nat Commun. .

Abstract

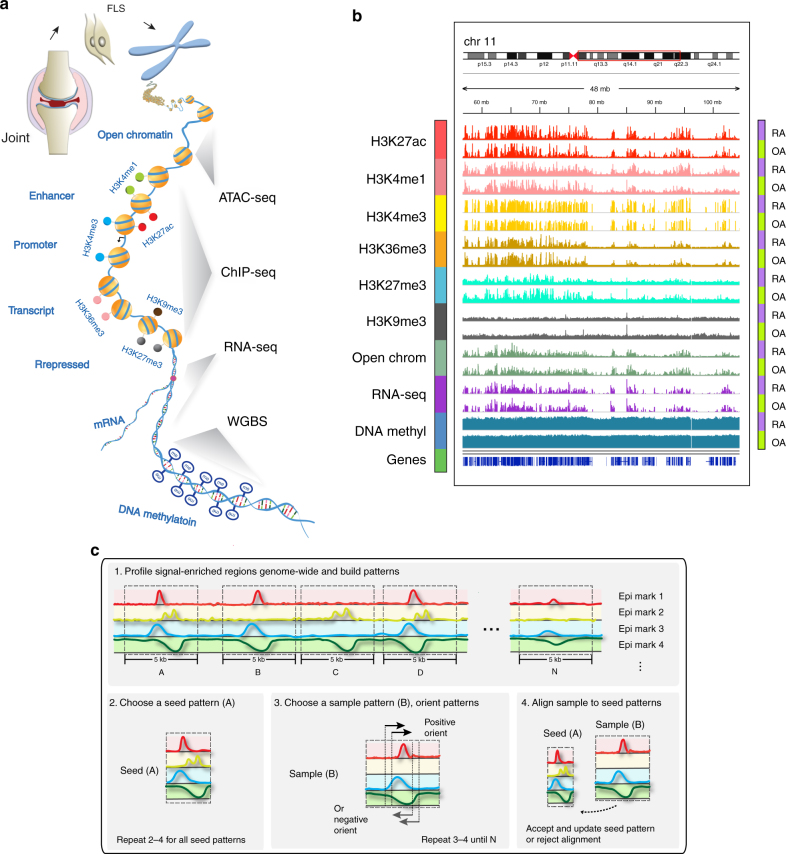
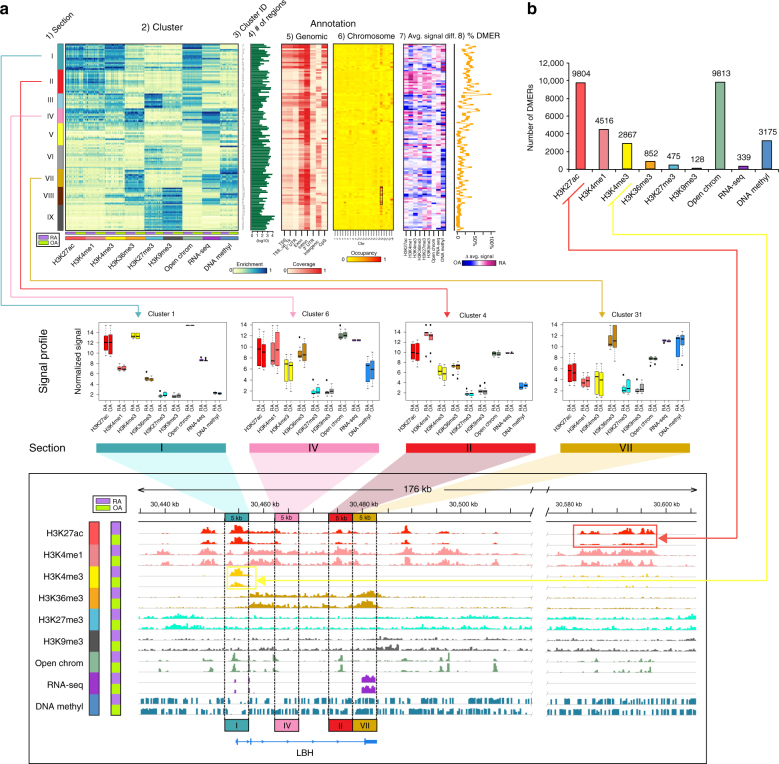
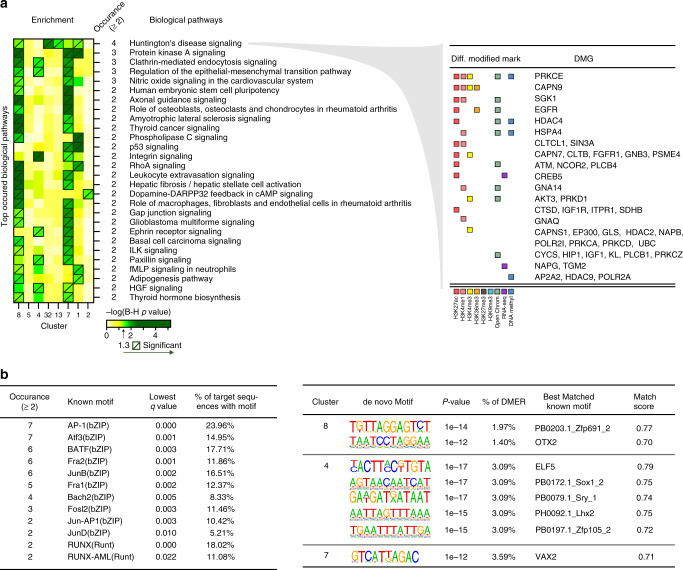
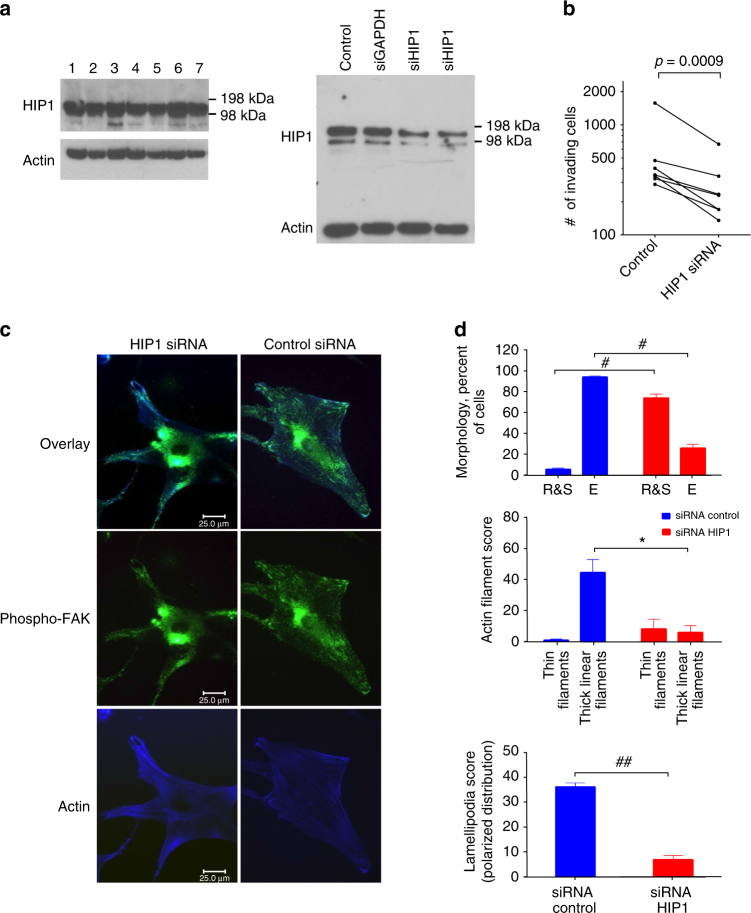
Epigenetics contributes to the pathogenesis of immune-mediated diseases like rheumatoid arthritis (RA). Here we show the first comprehensive epigenomic characterization of RA fibroblast-like synoviocytes (FLS), including histone modifications (H3K27ac, H3K4me1, H3K4me3, H3K36me3, H3K27me3, and H3K9me3), open chromatin, RNA expression and whole-genome DNA methylation. To address complex multidimensional relationship and reveal epigenetic regulation of RA, we perform integrative analyses using a novel unbiased method to identify genomic regions with similar profiles. Epigenomically similar regions exist in RA cells and are associated with active enhancers and promoters and specific transcription factor binding motifs. Differentially marked genes are enriched for immunological and unexpected pathways, with "Huntington's Disease Signaling" identified as particularly prominent. We validate the relevance of this pathway to RA by showing that Huntingtin-interacting protein-1 regulates FLS invasion into matrix. This work establishes a high-resolution epigenomic landscape of RA and demonstrates the potential for integrative analyses to identify unanticipated therapeutic targets.


Conflict of interest statement

E.P., V.K., D.P., J.W.W., Y.B., S.N., and K.E.B. are employees of Janssen Pharmaceuticals. All the remaining authors declare no competing interests.

Figures

Fig. 1
Fig. 1
Overview of RA integrative analysis pipeline. a Schematic representation of major omics methods used in RA FLS. b Epigenomic landscape of RA FLS with six histone modifications, open chromatin, RNA-seq and DNA methylation. The figure shows an example of the relative signal intensity across a selected region of the genome for each mark in RA and OA FLS. In addition, the locations across chromosomes for the selected regions are indicated. c Schematic overview of how EpiSig integrates different epigenetic marks. The algorithm detects significant signals from sequencing data in 5 kb genome regions, clusters regions based on similar epigenomic patterns, and identify epigenomically similar regions
Fig. 2
Fig. 2
Genome-wide multidimensional clusters in RA and non-RA genomes. a A total of 125 genome-wide 5 kb multidimensional clusters were grouped into nine sections based epigenetic marks. From left to right of the upper panel shows the aligned 125 clusters, each of which includes 11 RA and 11 OA FLS lines: (1) the organization of clusters into epigenetically defined sections (see text); (2) genome annotation heatmap with coverage of each cluster, with 22 separate FLS lines shown within each cluster; (3) 125 cluster IDs; (4) the number of 5 kb regions in each epigenetic cluster (log10 scale); (5) the characteristics of each region within the clusters, such as the relative abundance of transcription start sites (TSS), gene bodies, or introns; (6) chromosome location of each region within the clusters (box shows high occupancy at chromosome 19); (7) differences in signals of epigenetic marks between RA and OA; and (8) percentage of DMERs each cluster. In the middle panel, boxplot examples of clusters in different sections corresponding to LBH regions in the genome browser (bottom panel) demonstrating differences between RA and OA and how the FLS marks can be categorized as sections I, II, IV, and VII. b DMERs with enhancer and promoter histone marks account for the most common differences between RA and OA. The red and yellow lines connect H3K27ac and H3K4me3 bars to the genome browser, which shows an example of how those marks are differentially modified between RA and OA
Fig. 3
Fig. 3
Integrative analysis identified 13 clusters with significantly enriched DMERs. a The 13 enriched clusters are shown with the number of DMERs in each cluster. Below, the relative abundance of various types of differential marks is shown and demonstrates the high abundance of active enhancer and active promoter marks (section I and II). Nine clusters are associated with active enhancers and four with active promoters. b Characterization of three clusters with the most DMERs (1, 7, and 8). Top DMGs (left) and top enriched biological pathways associated with these genes (right) are shown
Fig. 4
Fig. 4
Prioritized enriched biological pathways and transcription factor (TF) motifs analysis. a Prioritized biological pathways ranked by the number of occurrences in the eight clusters with significantly enriched pathways (left) and DMGs with associated DMERs in “Huntington’s Disease Signaling” pathway (right). b Prioritized TF motifs ranked by the frequency in 13 clusters (left). The significantly enriched de novo TF binding motifs are shown on the right
Fig. 5
Fig. 5
Biologic validation of HIP1 as a key pathway in RA FLS. a Left: HIP1 protein expression in FLS; right: decreased HIP1 expression induced by siRNA knockdown. b HIP1 deficiency significantly reduced RA FLS invasion through Matrigel. c HIP1 and cytoskeletal rearrangement. Left three panels: morphologic differences in HIP1 deficient cells demonstrate a stellar morphology with reduced number and size of lamellipodia and reduced co-localization of phospho-FAK. Right three panels: RA FLS transfected with siRNA control (green = phospho-FAK; blue = phalloidin/actin filaments; ×600 magnification). d Altered phenotype of the HIP1-deficient FLS. Top panel: siRNA HIP1 had reduced cell elongation (E elongated; R&S round and stellar morphology; #p-value = 0.0006). Middle panel: siRNA HIP1 decreased thin central filaments and thick actin filaments. *p-value = 0.003). Bottom panel: siRNA HIP1 knockdown also reduced the number of lamellipodia and their polarized distribution. (##p-value = 0.0008). All p-values are calculated by paired t-test, and error bars indicate standard deviations

References

    1. Asif Amin M, Fox DA, Ruth JH. Synovial cellular and molecular markers in rheumatoid arthritis. Semin. Immunopathol. 2017;39:385–393. doi: 10.1007/s00281-017-0631-3. - DOI - PMC - PubMed
    1. Richardson BC, Patel DR. Epigenetics in 2013. DNA methylation and miRNA--key roles in systemic autoimmunity. Nat. Rev. Rheumatol. 2014;10:72–74. doi: 10.1038/nrrheum.2013.211. - DOI - PMC - PubMed
    1. Nielsen HM, Tost J. Epigenetic changes in inflammatory and autoimmune diseases. Subcell. Biochem. 2013;61:455–478. doi: 10.1007/978-94-007-4525-4_20. - DOI - PubMed
    1. Whitaker JW, et al. An imprinted rheumatoid arthritis methylome signature reflects pathogenic phenotype. Genome Med. 2013;5:40. doi: 10.1186/gm444. - DOI - PMC - PubMed
    1. Ai R, et al. DNA methylome signature in early rheumatoid arthritis synoviocytes compared with longstanding rheumatoid arthritis synoviocytes. Arthritis Rheumatol. 2015;67:1978–1980. doi: 10.1002/art.39123. - DOI - PMC - PubMed

Publication types