

Possible causes of data model discrepancy in the temperature history of the last Millennium
- PMID: 29765075
- PMCID: PMC5953951
- DOI: 10.1038/s41598-018-25862-2
Possible causes of data model discrepancy in the temperature history of the last Millennium
Abstract
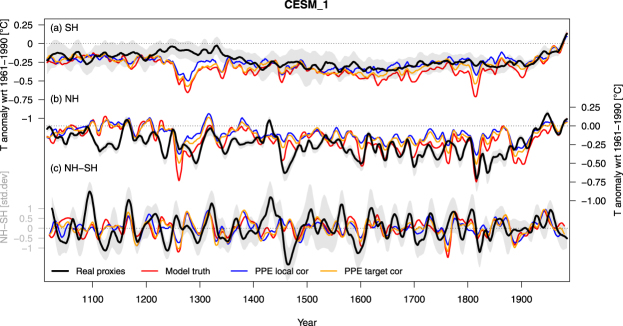
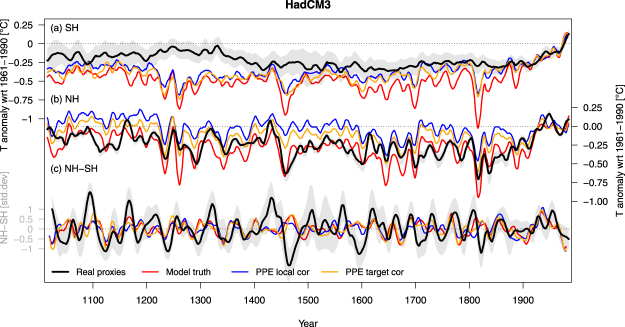
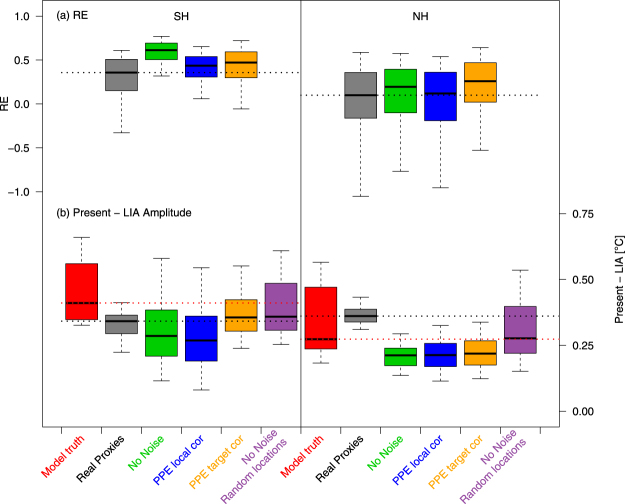
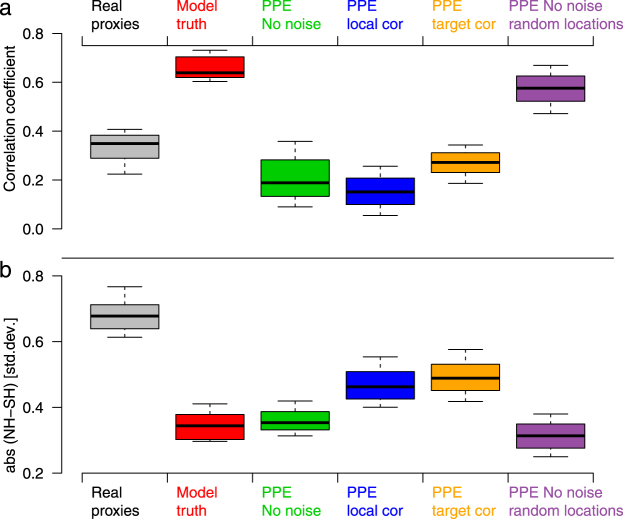
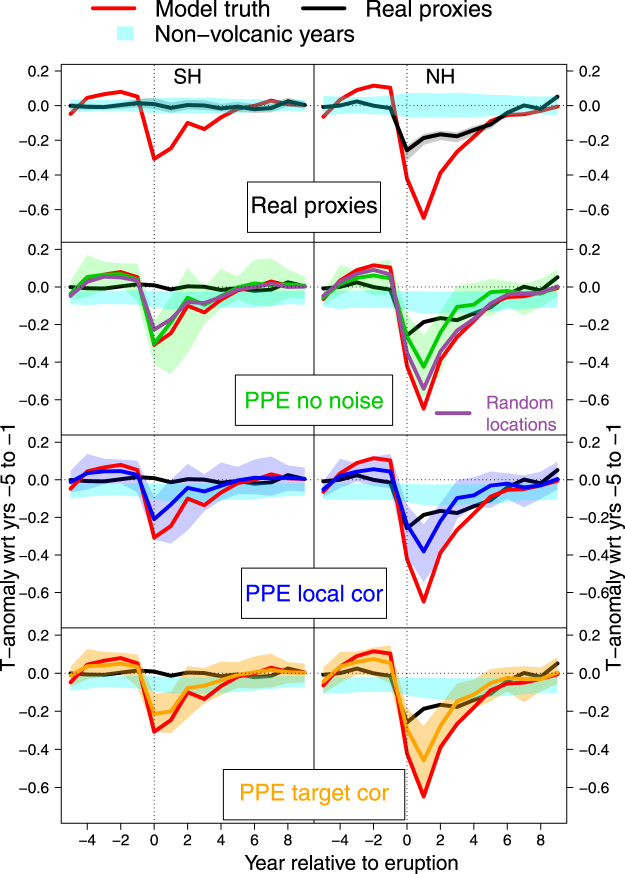
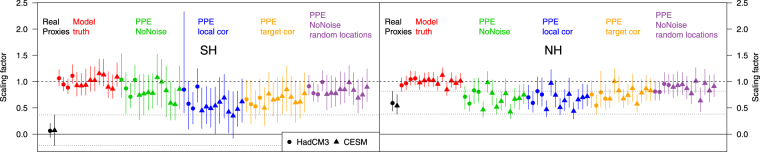
Model simulations and proxy-based reconstructions are the main tools for quantifying pre-instrumental climate variations. For some metrics such as Northern Hemisphere mean temperatures, there is remarkable agreement between models and reconstructions. For other diagnostics, such as the regional response to volcanic eruptions, or hemispheric temperature differences, substantial disagreements between data and models have been reported. Here, we assess the potential sources of these discrepancies by comparing 1000-year hemispheric temperature reconstructions based on real-world paleoclimate proxies with climate-model-based pseudoproxies. These pseudoproxy experiments (PPE) indicate that noise inherent in proxy records and the unequal spatial distribution of proxy data are the key factors in explaining the data-model differences. For example, lower inter-hemispheric correlations in reconstructions can be fully accounted for by these factors in the PPE. Noise and data sampling also partly explain the reduced amplitude of the response to external forcing in reconstructions compared to models. For other metrics, such as inter-hemispheric differences, some, although reduced, discrepancy remains. Our results suggest that improving proxy data quality and spatial coverage is the key factor to increase the quality of future climate reconstructions, while the total number of proxy records and reconstruction methodology play a smaller role.
Conflict of interest statement
The authors declare no competing interests.
Figures
References
-
- Masson-Delmotte, V. et al. Information from Paleoclimate Archives. Clim. Change 2013 Phys. Sci. Basis Contrib. Work. Group Fifth Assess. Rep. Intergov. Panel Clim. Change 383–464, 10.1017/CBO9781107415324.013 (2013).
-
- PAGES-2k-Consortium Continental-scale temperature variability during the past two millennia. Nat. Geosci. 2013;6:339–346. doi: 10.1038/ngeo1797. - DOI
-
- Luterbacher J, et al. European summer temperatures since Roman times. Environ. Res. Lett. 2016;11:024001. doi: 10.1088/1748-9326/11/2/024001. - DOI
-
- Smerdon, J. E. & Pollack, H. N. Reconstructing Earth’s surface temperature over the past 2000 years: the science behind the headlines. Wiley Interdiscip. Rev. Clim. Change7, 746–771, 10.1002/wcc.418 (2016).
-
- Wilson R, et al. Last millennium northern hemisphere summer temperatures from tree rings: Part I: The long term context. Quat. Sci. Rev. 2016;134:1–18. doi: 10.1016/j.quascirev.2015.12.005. - DOI
Publication types
Grants and funding
LinkOut - more resources
Full Text Sources
Other Literature Sources
