. 2018 May 15;8(1):7587.
doi: 10.1038/s41598-018-26037-9.

Collective gradient sensing in fish schools

Affiliations

Collective gradient sensing in fish schools

James G Puckett et al. Sci Rep. .

Abstract

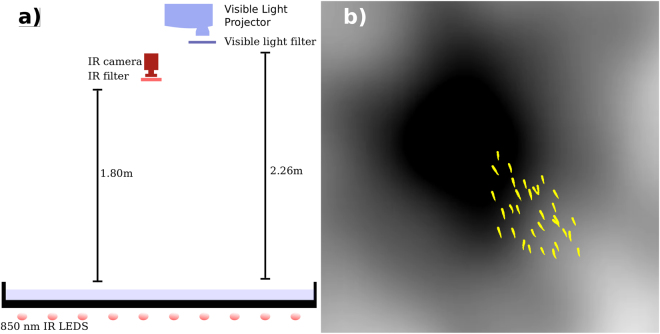
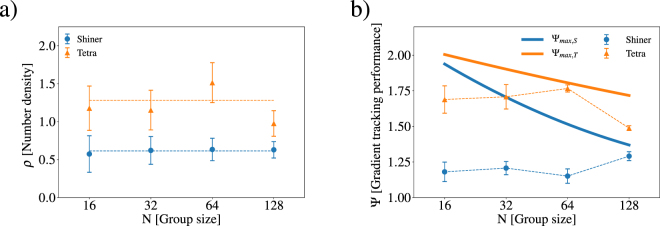
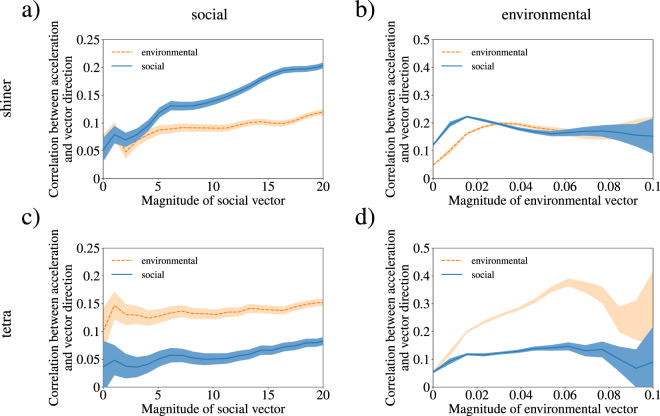
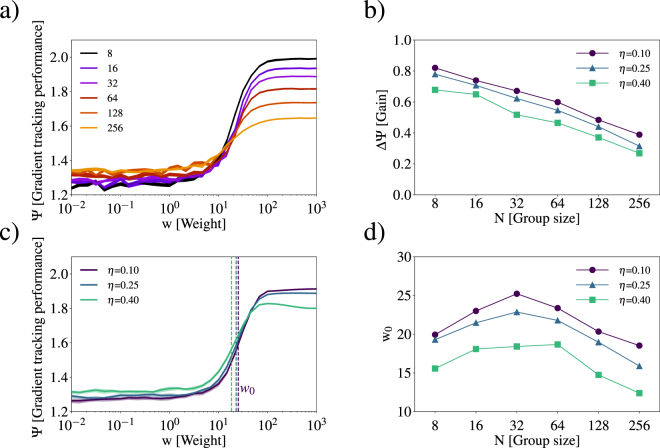
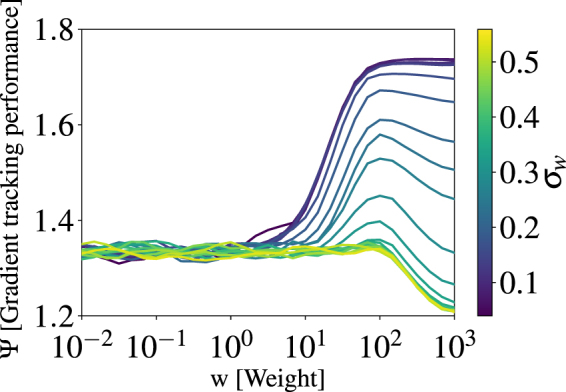
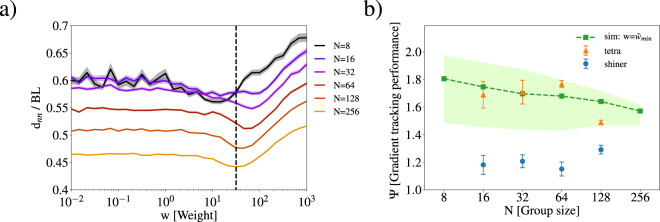
Throughout the animal kingdom, animals frequently benefit from living in groups. Models of collective behaviour show that simple local interactions are sufficient to generate group morphologies found in nature (swarms, flocks and mills). However, individuals also interact with the complex noisy environment in which they live. In this work, we experimentally investigate the group performance in navigating a noisy light gradient of two unrelated freshwater species: golden shiners (Notemigonuscrysoleucas) and rummy nose tetra (Hemigrammus bleheri). We find that tetras outperform shiners due to their innate individual ability to sense the environmental gradient. Using numerical simulations, we examine how group performance depends on the relative weight of social and environmental information. Our results highlight the importance of balancing of social and environmental information to promote optimal group morphologies and performance.


Conflict of interest statement

The authors declare no competing interests.

Figures

Figure 1
Figure 1
(Left) A schematic of the apparatus showing the infrared camera and projector placed overhead the experimental tank. The tank is lit from below with several infrared lights. (Right) The silhouettes of a group of 32 tetras are superimposed on the dynamic light field through which they navigate. The image is cropped, showing only a small region of the larger tank to illustrate the scale of dark spot to the body length of a fish.
Figure 2
Figure 2
(a) The average number density ρ = Agroup/(NBL2) shown for shiners (blue circles) and tetras (orange triangles) as a function of the group size N. (b) The group gradient tracking performance, Ψ, is shown as a function of group size N for both shiners (blue circles) and tetras (orange triangles). The error bars represent the standard error of the group performance over replicates. The thick lines represent maximum group performance of a group of N individuals with the average area per individual for shiners and tetras.
Figure 3
Figure 3
Correlations between accelerations of shiners and the social and environmental cues (y-axis) are shown as functions of the magnitude of the social (a) and environmental (b) vectors (x-axis), respectively. Similarly, correlations between social and environmental vectors and the accelerations of tetras are shown as functions of the magnitude of the social (c) and environmental vectors (d), respectively. For all subfigures, the correlation between the accelerations and social vector are dark (blue) and between the accelerations and environmental vector are light (orange). All shaded regions denote twice the standard error.
Figure 4
Figure 4
(a) Group performance shown as a function of weight w for group size N = 8, 16, 32, 64, 128, and 256. (b) The performance gain ΔΨ = Ψmax(w) − Ψ(w = 0) shown as a function of group size for different noise scales η = 0.10,0.25 and 0.40. (c) Gradient tracking performance Ψ shown as a function of weight w for different η and N = 32. The dashed vertical line shows w0 the weight at which Ψ reaches half maximum, where Ψ = Ψ(w = 0) + 0.5ΔΨ. (d) The w0 shown as a function of N for different noise scales η.
Figure 5
Figure 5
The gradient tracking performance Ψ is shown for N = 128 as a function of weight w for different gradient sensing error σw.
Figure 6
Figure 6
(a) Nearest neighbour distance of simulated schools is shown as a function of the weight w for group sizes N. The dashed vertical line is the weight w˜min which minimises dnn for all N. (b) Gradient tracking performance of the numerical results for w=w˜min32 (dark green squares), where the shaded region shows the range of Ψ corresponding to simulated weights from w ≈ 14 to 64. These weights are those which minimise dnn for N = 256 and 16 respectively. The experimental results are overlaid for the rummy nose tetras (orange triangles) and shiners (blue circles).

References

    1. Couzin ID, Krause J. Self-organization and collective behavior in vertebrates. Advances in the Study of Behavior. 2003;32:1–75. doi: 10.1016/S0065-3454(03)01001-5. - DOI
    1. Sumpter, D. J. Collective animal behavior (Princeton University Press, Princeton, NJ, 2010).
    1. Puckett JG, Kelley DH, Ouellette NT. Searching for effective forces in laboratory insect swarms. Scientific reports. 2014;4:4766. doi: 10.1038/srep04766. - DOI - PMC - PubMed
    1. Reynolds CW. Flocks, herds and schools: A distributed behavioral model. ACM SIGGRAPH Computer Graphics. 1987;21:25–34. doi: 10.1145/37402.37406. - DOI
    1. Huth A, Wissel C. The simulation of fish schools in comparison with experimental data. Ecological modelling. 1994;76:135–145. doi: 10.1016/0304-3800(94)90013-2. - DOI

Publication types

LinkOut - more resources