. 2018 May 1:9:416.
doi: 10.3389/fphar.2018.00416. eCollection 2018.

Brain Lipopolysaccharide Preconditioning-Induced Gene Reprogramming Mediates a Tolerance State in Electroconvulsive Shock Model of Epilepsy

Affiliations

Brain Lipopolysaccharide Preconditioning-Induced Gene Reprogramming Mediates a Tolerance State in Electroconvulsive Shock Model of Epilepsy

Elham Amini et al. Front Pharmacol. .

Abstract

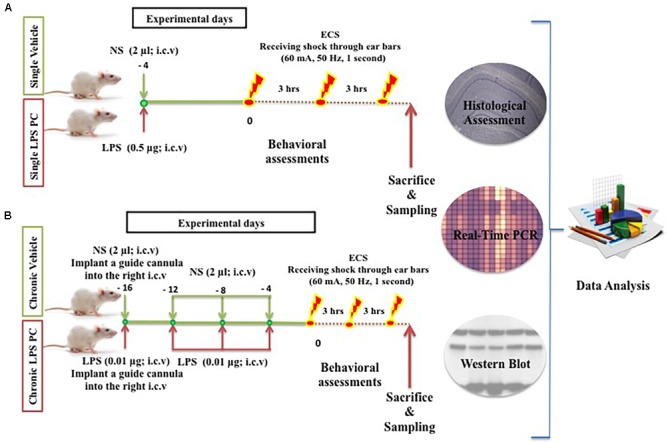
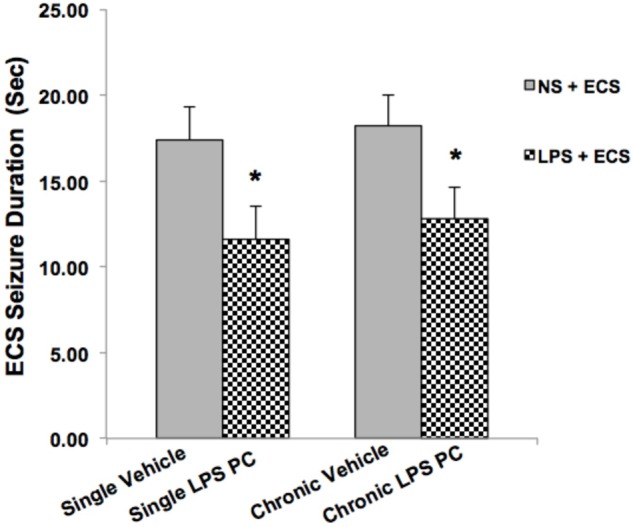
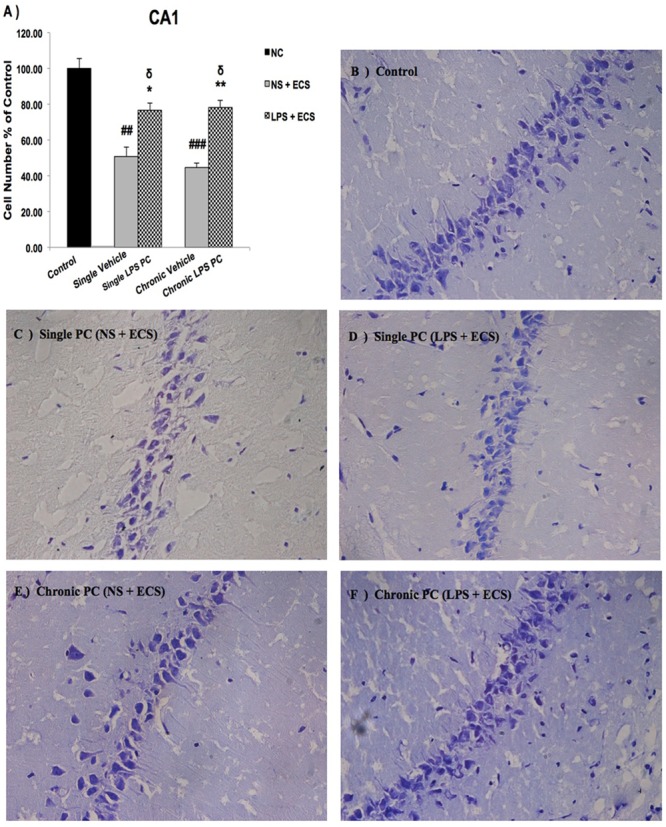
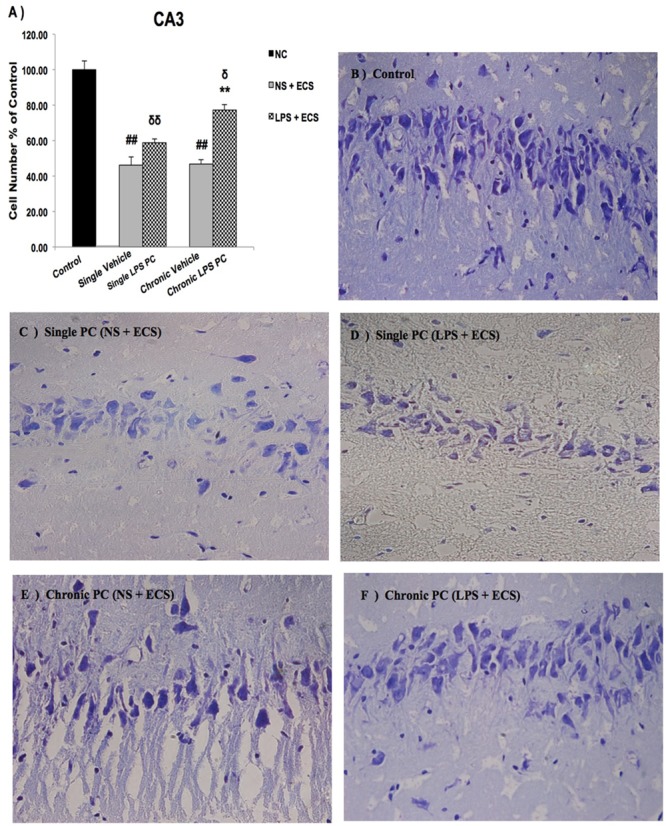
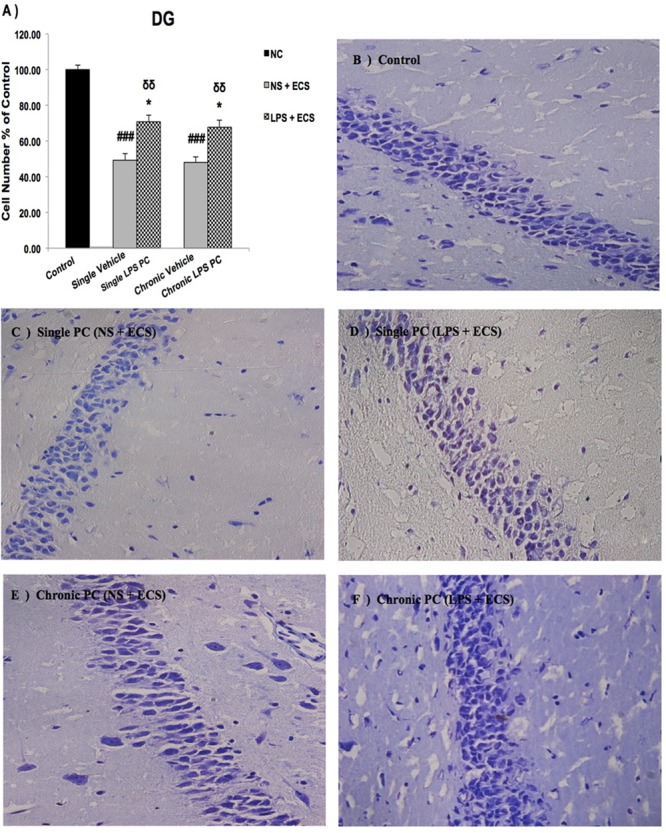
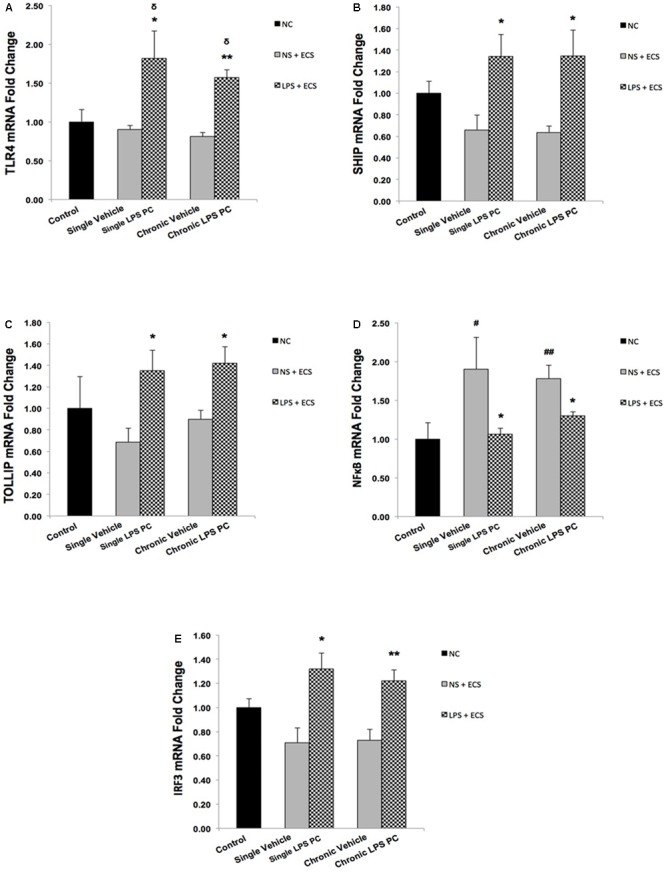
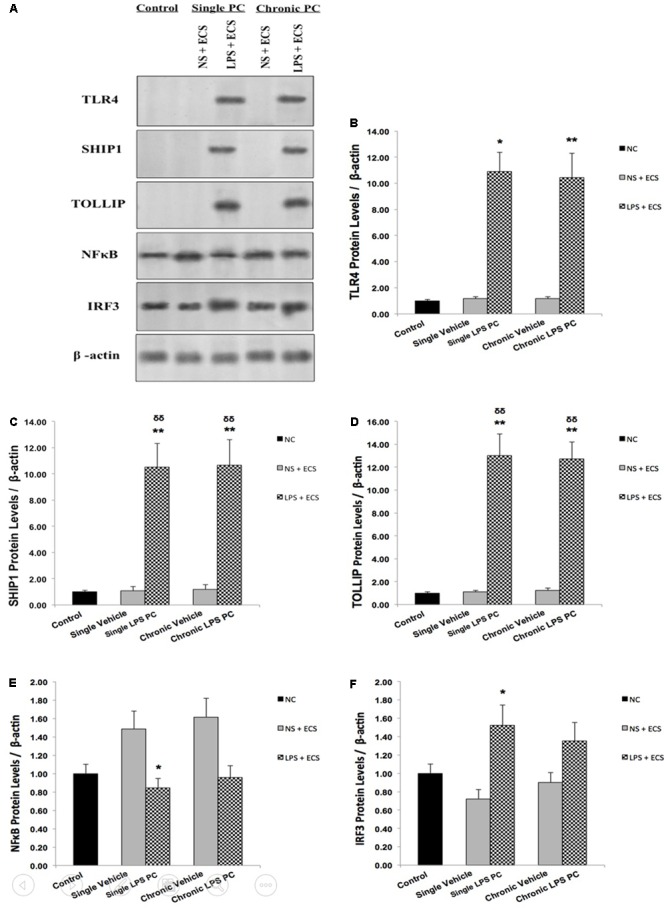
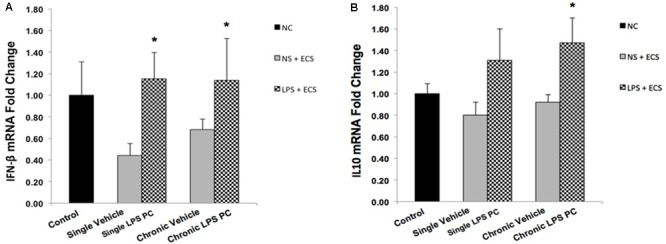
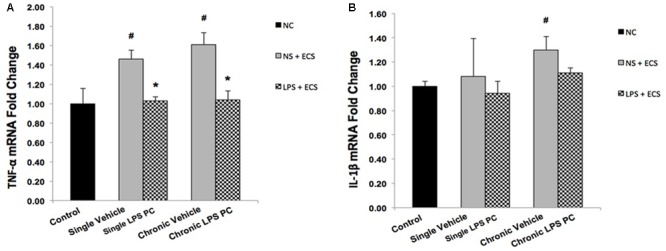
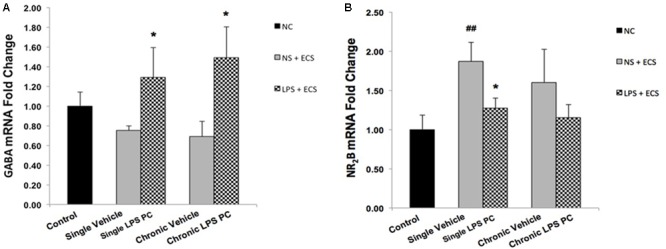
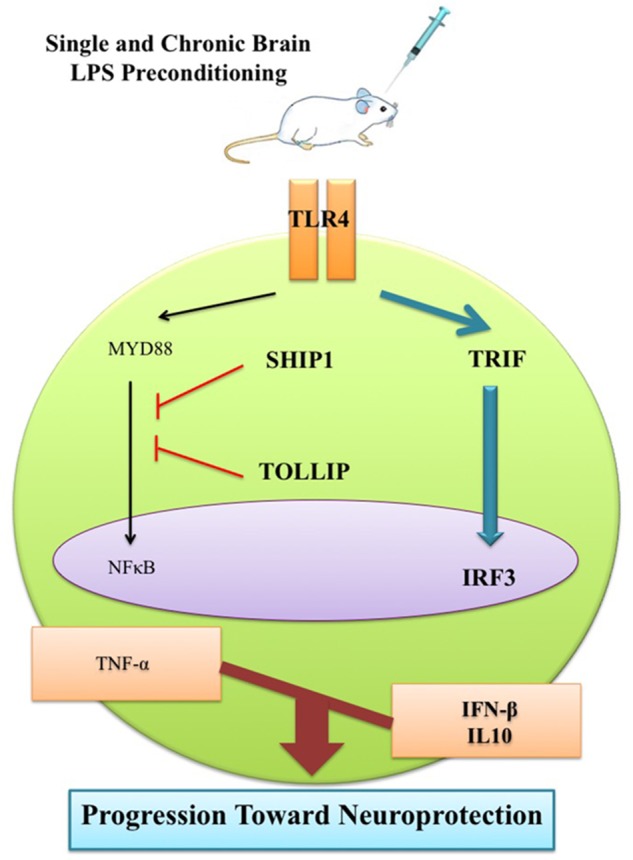
There is increasing evidence pointing toward the role of inflammatory processes in epileptic seizures, and reciprocally, prolonged seizures induce more inflammation in the brain. In this regard, effective strategies to control epilepsy resulting from neuroinflammation could be targeted. Based on the available data, preconditioning (PC) with low dose lipopolysaccharide (LPS) through the regulation of the TLR4 signaling pathway provides neuroprotection against subsequent challenge with injury in the brain. To test this, we examined the effects of a single and chronic brain LPS PC, which is expected to lead to reduction of inflammation against epileptic seizures induced by electroconvulsive shock (ECS). A total of 60 male Sprague Dawley rats were randomly assigned to five groups: control, vehicle (single and chronic), and LPS PC (single and chronic). We first recorded the data regarding the behavioral and histological changes. We further investigated the alterations of gene and protein expression of important mediators in relation to TLR4 and inflammatory signaling pathways. Interestingly, significant increased presence of NFκB inhibitors [Src homology 2-containing inositol phosphatase-1 (SHIP1) and Toll interacting protein (TOLLIP)] was observed in LPS-preconditioned animals. This result was also associated with over-expression of IRF3 activity and anti-inflammatory markers, along with down-regulation of pro-inflammatory mediators. Summarizing, the analysis revealed that PC with LPS prior to seizure induction may have a neuroprotective effect possibly by reprogramming the signaling response to injury.

Keywords: brain injury; gene reprogramming; neuroprotection; preconditioning; seizures; signaling pathway; tolerance; treatment.


Figures

FIGURE 1
FIGURE 1
Schematic diagram of experimental design and procedures in the (A) single and (B) chronic LPS preconditioning and vehicle groups in this study.
FIGURE 2
FIGURE 2
Effect of preconditioning by single low dose and chronic ultra-low dose of LPS on seizure duration induced by ECS administration in a rat model. Asterisk () denotes a significant difference between the preconditioned groups and vehicle groups. Statistical analysis was done according to Student’s t-test with significance levels of ρ < 0.05 vs. the vehicle groups. Data are shown as mean ± SEM of 12 animals (n = 12). ECS, electroconvulsive shock; NS, normal saline; LPS, lipopolysaccharide; PC, preconditioning.
FIGURE 3
FIGURE 3
Photomicrographs of Nissl-stained CA1 sub-region of rat brain hippocampus in the ECS model of epilepsy. (A) Effect of single low dose and chronic ultra-low dose of LPS preconditioning on the number of CA1 cells, (B) control, (C) vehicle (single NS), (D) single LPS preconditioned groups, (E) vehicle (chronic NS), and (F) chronic LPS preconditioned groups in the ECS model. Scale bars are equal to 50 μm. Asterisk () denotes a significant difference between the preconditioned groups and vehicle groups. Delta (δ) denotes a significant difference between the preconditioned groups and control groups. Hash (#) denotes a significant difference between the vehicle groups and control groups. Statistical analysis has been done according to the one-way ANOVA with significance levels of ρ < 0.05 and ∗∗ρ < 0.01; δρ < 0.05; ##ρ < 0.01, and ###ρ < 0.001. Data are shown as mean% ± SEM of three animals (n = 3), which expressed as the cell number percentage with respect to the control. ECS, electroconvulsive shock; NS, normal saline; LPS, lipopolysaccharide; PC, preconditioning; NC, no current was passed through the electrodes.
FIGURE 4
FIGURE 4
Photomicrographs of Nissl-stained CA3 sub-region of rat brain hippocampus in the ECS model of epilepsy (n = 3). (A) Effect of single low dose and chronic ultra-low dose of LPS preconditioning on the number of CA3 cells, (B) control, (C) vehicle (single NS), (D) single LPS preconditioned groups, (E) vehicle (chronic NS), and (F) chronic LPS preconditioned groups in the ECS model. Scale bars are equal to 50 μm. Asterisk () denotes a significant difference between the preconditioned groups and vehicle groups. Delta (δ) denotes a significant difference between the preconditioned groups and control groups. Hash (#) denotes a significant difference between the vehicle groups and control groups. Statistical analysis has been done according to the one-way ANOVA with significance levels of ∗∗ρ < 0.01; δρ < 0.05, δδρ < 0.01; and ##ρ < 0.01. Data are shown as mean% ± SEM of three animals (n = 3), which expressed as the cell number percentage with respect to the control. ECS, electroconvulsive shock; NS, normal saline; LPS, lipopolysaccharide; PC, preconditioning; NC, no current was passed through the electrodes.
FIGURE 5
FIGURE 5
Photomicrographs of Nissl-stained DG sub-region of rat brain hippocampus in the ECS model of epilepsy (n = 3). (A) Effect of single low dose and chronic ultra-low dose of LPS preconditioning on the number of DG cells, (B) control, (C) vehicle (single NS), (D) single LPS preconditioned groups, (E) vehicle (chronic NS), and (F) chronic LPS preconditioned groups in the ECS model. Scale bars are equal to 50 μm. Asterisk () denotes a significant difference between the preconditioned groups and vehicle groups. Delta (δ) denotes a significant difference between the preconditioned groups and control groups. Hash (#) denotes a significant difference between the vehicle groups and control groups. Statistical analysis has been done according to the one-way ANOVA with significance levels of ρ < 0.05; δδρ < 0.01; and ###ρ < 0.001. Data are shown as mean% ± SEM of three animals (n = 3), which expressed as the cell number percentage with respect to the control. ECS, electroconvulsive shock; NS, normal saline; LPS, lipopolysaccharide; PC, preconditioning; NC, no current was passed through the electrodes.
FIGURE 6
FIGURE 6
Expression level of genes related to TLR4 signaling pathway in the hippocampus region of rat brain in the ECS model of epilepsy. The graphs above display the effect of PC by single low dose and chronic ultra-low dose of LPS on the gene expression level of (A) TLR4, (B) SHIP1, (C) TOLLIP, (D) NFκB, and (E) IRF3 in hippocampus in control, single preconditioned, and chronic preconditioned groups. Asterisk () denotes a significant difference between the preconditioned groups and vehicle groups. Delta (δ) denotes a significant difference between the preconditioned groups and control groups. Hash (#) denotes a significant difference between the vehicle groups and control groups. Statistical analysis has been done according to the one-way ANOVA with significance levels of ρ < 0.05; ∗∗ρ < 0.01; δρ < 0.05; #ρ < 0.05; and ##ρ < 0.01. Data are shown as mean ± SEM of three animals (n = 3), which expressed as fold change relative to control group. ECS, electroconvulsive shock; NS, normal saline; LPS, lipopolysaccharide; PC, preconditioning; NC, no current was passed through the electrodes.
FIGURE 7
FIGURE 7
The level of protein expression in the hippocampus of rat brain in ECS model of Epilepsy. (A) Representative western blots in the ECS model of epilepsy showing protein expression of TLR4, SHIP1, TOLLIP, NFκB, and IRF3 in the hippocampus in control, single and chronic LPS-preconditioned, and vehicle groups. The graphs above display the effect of preconditioning by single low dose and chronic ultra-low dose of LPS on the protein expression level of (B) TLR4, (C) SHIP1, (D) TOLLIP, (E) NFκB, and (F) IRF3 in the hippocampus in control, single and chronic LPS-preconditioned, and vehicle groups. Asterisk () denotes a significant difference between the preconditioned groups and vehicle groups. Delta (δ) denotes a significant difference between the preconditioned groups and control groups. Statistical analysis was done according to the one-way ANOVA with significance levels of ρ < 0.05, ∗∗ρ < 0.01; and δδρ < 0.01. Data are shown as mean ± SEM of three (n = 3), which expressed as fold change relative to control group. ECS, electroconvulsive shock; NS, normal saline; LPS, lipopolysaccharide; PC, preconditioning; NC, no current was passed through the electrodes.
FIGURE 8
FIGURE 8
Gene expression level of IFN-β and IL10 in the hippocampus region of rat brain in the ECS model of epilepsy. The graphs above display the effect of preconditioning by single low dose and chronic ultra-low dose of LPS on the gene expression level of (A) IFN-β and (B) IL10 in hippocampus in control, single preconditioned, and chronic preconditioned groups. Asterisk () denotes a significant difference between the preconditioned groups and vehicle groups. Statistical analysis has been done according to the one-way ANOVA with significance levels of ρ < 0.05. Data are shown as mean ± SEM of three animals (n = 3), which expressed as fold change relative to control group. ECS, electroconvulsive shock; NS, normal saline; LPS, lipopolysaccharide; PC, preconditioning; NC, no current was passed through the electrodes.
FIGURE 9
FIGURE 9
Gene expression level of TNF-α and IL-1β in the hippocampus region of rat brain in the ECS model of epilepsy. The graphs above display the effect of preconditioning by single low dose and chronic ultra-low dose of LPS on the gene expression level of (A) TNF-α and (B) IL-1β in hippocampus in control, single preconditioned, and chronic preconditioned groups. Asterisk () denotes a significant difference between the preconditioned groups and vehicle groups. Hash (#) denotes a significant difference between the vehicle groups and control groups. Statistical analysis was done according to the one-way ANOVA with significance levels of ρ < 0.05 and #ρ < 0.05. Data are shown as mean ± SEM of three animals (n = 3), which expressed as fold change relative to control group. ECS, electroconvulsive shock; NS, normal saline; LPS, lipopolysaccharide; PC, preconditioning; NC, no current was passed through the electrodes.
FIGURE 10
FIGURE 10
Gene expression level of GABAA and NR2B in the hippocampus region of rat brain in the ECS model of epilepsy. The graphs above display the effect of preconditioning by single low dose and chronic ultra-low dose of LPS on the gene expression level of (A) GABAA and (B) NR2B in hippocampus in control, single preconditioned, and chronic preconditioned groups. Asterisk () denotes a significant difference between the preconditioned groups and vehicle groups. Hash (#) denotes a significant difference between the vehicle groups and control groups. Statistical analysis was done according to the one-way ANOVA with significance levels of ρ < 0.05 and ##ρ < 0.01. Data are shown as mean ± SEM of three animals (n = 3), which expressed as fold change relative to control group. ECS, electroconvulsive shock; NS, normal saline; LPS, lipopolysaccharide; PC, preconditioning; NC, no current was passed through the electrodes.
FIGURE 11
FIGURE 11
Schematic representation of gene expression pattern related to TLR4 signaling pathway following epileptic seizure. Low dose of LPS reprograms TLR4 signaling in response to subsequent brain injury. This reprogrammed response that is reminiscent of neuroprotection comes with reduction of NFκB activity to reduce pro-inflammatory mediators, up-regulation of IRF3 activity, and enhancement in production of anti-inflammatory/type I IFN associated genes in the LPS-preconditioned animals following brain damage.

References

    1. Aalbers M. W., Rijkers K., Majoie H. J., Dings J. T., Schijns O. E., Schipper S., et al. (2014). The influence of neuropathology on brain inflammation in human and experimental temporal lobe epilepsy. J. Neuroimmunol. 271 36–42. 10.1016/j.jneuroim.2014.03.016 - DOI - PubMed
    1. Amhaoul H., Hamaide J., Bertoglio D., Reichel S. N., Verhaeghe J., Geerts E., et al. (2015). Brain inflammation in a chronic epilepsy model: evolving pattern of the translocator protein during epileptogenesis. Neurobiol. Dis. 82 526–539. 10.1016/j.nbd.2015.09.004 - DOI - PubMed
    1. Amhaoul H., Staelens S., Dedeurwaerdere S. (2014). Imaging brain inflammation in epilepsy. Neuroscience 279 238–252. 10.1016/j.neuroscience.2014.08.044 - DOI - PubMed
    1. Amini E., Rezaei M., Ibrahim N. M., Golpich M., Ghasemi R., Mohamed Z., et al. (2015). A molecular approach to epilepsy management: from current therapeutic methods to preconditioning efforts. Mol. Neurobiol. 52 492–513. 10.1007/s12035-014-8876-5 - DOI - PubMed
    1. Cardoso A., Lukoyanova E. A., Madeira M. D., Lukoyanov N. V. (2011). Seizure-induced structural and functional changes in the rat hippocampal formation: comparison between brief seizures and status epilepticus. Behav. Brain Res. 225 538–546. 10.1016/j.bbr.2011.07.057 - DOI - PubMed

LinkOut - more resources