. 2018 May 1:9:434.
doi: 10.3389/fphar.2018.00434. eCollection 2018.

Evodiamine, a Novel NOTCH3 Methylation Stimulator, Significantly Suppresses Lung Carcinogenesis in Vitro and in Vivo

Affiliations

Evodiamine, a Novel NOTCH3 Methylation Stimulator, Significantly Suppresses Lung Carcinogenesis in Vitro and in Vivo

Tao Su et al. Front Pharmacol. .

Abstract

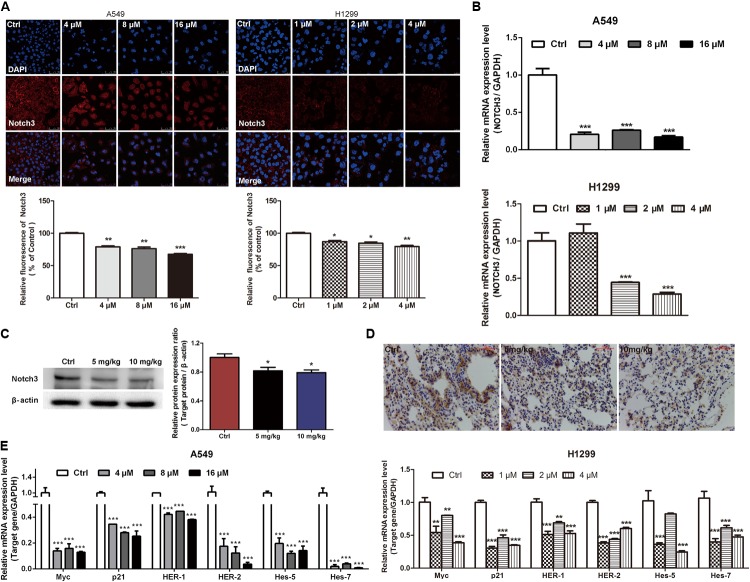
Lung cancer is a leading cause of cancer-related deaths worldwide. NOTCH3 signaling is mainly expressed in non-small cell lung carcinoma (NSCLC), and has been proposed as a therapeutic target of NSCLC. While, few agents for preventing or treating NSCLC via targeting NOTCH3 signaling are used in modern clinical practice. Evodiamine (EVO), an alkaloid derived from Euodiae Fructus, possesses low toxicity and has long been shown to exert anti-lung cancer activity. However, the underlying anti-lung cancer mechanisms of EVO are not yet fully understood. In this study, we explored the involvement of NOTCH3 signaling in the anti-lung cancer effects of EVO. Urethane-induced lung cancer mouse model and two NSCLC cell models, A549 and H1299, were used to evaluate the in vivo and in vitro anti-lung cancer action of EVO. A DNA methyltransferase inhibitor was employed to investigate the role of NOTCH3 signaling in the anti-lung cancer effects of EVO. Results showed that EVO potently reduced tumor size and tumor numbers in mice, and inhibited NOTCH3 in the tumors. EVO also dramatically reduced cell viability, induced G2/M cell cycle arrest, inhibited cell migration and reduced stemness in cultured NSCLC cells. Mechanistic studies showed that EVO potently inhibited NOTCH3 signaling by activation of DNMTs-induced NOTCH3 methylation. Importantly, inhibition of NOTCH3 methylation in NSCLC cells diminished EVO's anti-NSCLC effects. Collectively, EVO, a novel NOTCH3 methylation stimulator, exerted potent anti-lung cancer effects partially by inhibiting NOTCH3 signaling. These findings provide new insight into the EVO's anti-NSCLC action, and suggest a potential role of EVO in lung cancer prevention and treatment.

Keywords: DNA methyltransferases; NOTCH3 methylation; Notch3; evodiamine; lung cancer.


Figures

FIGURE 1
FIGURE 1
Anti-lung cancer effects of EVO in mice. (A) The photo of pulmonary nodules dissected from the FVB mice (scale bar: 10 mm). All photos were photographed using a stereoscopic microscope. (B) The tumor number, tumor volume and the percentage of different tumor size were shown (n = 10). (C) Body weights at different time points. In (B) and (C), data were presented as mean ± SD of ten mice. (D) Representative H&E staining images of lung tissues. Tumors were photographed under a fluorescence inversion microscope (scale bar: 50 μm). p < 0.05, ∗∗∗p < 0.001, vs. control group.
FIGURE 2
FIGURE 2
EVO exerted anti-lung cancer effects in vitro. (A) Cell viability was determined by the MTT assay. A549, H1299 or MRC-5 cells were treated with various concentrations of EVO (0–40 μM) or vehicle for 48 and 72 h, respectively. (B) H1299 cells were treated with vehicle or EVO (1, 2, and 4 μM) for 48 h. Cells were fixed, incubated with anti-EdU working solution, and then stained with DAPI. The images were captured using Leica3000B (Leica, GER). Representative images (left) and relative fluorescent levels (right) were shown. Fluorescent level of the vehicle-treated cells was regarded as 1. (C) H1299 cells were treated as previously described in (B). After fixation, cells were stained with PI and then analyzed using a flow cytometry. Representative images (left) and the statistical analysis of cell cycle data in three independent experiments (right) were shown. (D) Representative images of colony formation were captured after treatment with EVO (1, 2, and 4 μM) for 2 weeks (scale bar: 100 μm), and the quantification of colony numbers were shown. (E) Cells were treated with vehicle or EVO (1, 2, and 4 μM) for 48 h, then the cells were collected and detected by flow cytometry. Representative images and relative expression levels were shown. Expression level of the vehicle-treated cells was regarded as 100%. (F) H1299 cells were plated in 6-well plates, and 1 day later, wounds were created in the confluent monolayer followed by vehicle or EVO (1, 2, and 4 μM) treatment, each scratch was photographed after 12- and 24-h treatments. Data were presented as mean ± SD from three independent experiments,∗∗p < 0.01, ∗∗∗p < 0.001, vs. vehicle.
FIGURE 3
FIGURE 3
The expression of NOTCH3 in human lung tumors and cultured cells. (A) The expression of NOTCH3 in human normal lung tissues and lung tumor tissues were checked and analyzed in TCGA from MethHC database (http: //maplab.imppc.org/wanderer/). The dataset includes 488 cases of lung cancer patients and 58 cases of normal persons. (B) Kaplan–Meier analysis of the overall survival time of lung adenocarcinoma patients with high and low expressions of NOTCH3. (C) Normal lung tissues, pulmonary nodules, normal human bronchial epithelial cells (BEAS.2B) and NSCLC cells (A549 and H1299) were extracted for Western blot analysis by using antibody specific to Notch3, respectively. Data were presented as mean ± SD from three independent experiments, p < 0.05, ∗∗p < 0.01, vs. normal lung tissues or normal bronchial epithelial cells.
FIGURE 4
FIGURE 4
EVO inhibited NOTCH3 signaling in vitro and in vivo. (A) A549 and H1299 cells were treated with vehicle or EVO (4, 8, and 16 μM for A549 cells and 1, 2, and 4 μM for H1299 cells, respectively) for 48 h. NOTCH3 was detected by immunofluorescence assay. Cells were stained by an antibody recognizing Notch3 (red fluorescence), and the nuclei were visualized with the nuclear dye DAPI (blue fluorescence). Representative images and relative fluorescent levels were shown. (B) After 24 h treatment, total mRNA was extracted for NOTCH3 mRNA levels detection by using real-time PCR analysis. (C) Protein levels of Notch3 in vehicle- and EVO-treated groups were detected by Western blot analysis. Tissues in each group were mixed individually. (D) Representative photographs of immunohistochemical staining of NOTCH3 in the tissues of vehicle- and EVO-treated groups (5 mg/kg, 10 mg/kg). Tissues were immunohistochemically stained using an antibody against Notch3. (E) Total mRNA was extracted for NOTCH3 downstream gene (Myc, p21, HER-1, HER-2, hes-5, and hes-7) expression levels detection by using real-time PCR analysis. Data were presented as mean ± SD from three independent experiments, p < 0.05, ∗∗p < 0.01, ∗∗∗p < 0.001, vs. vehicle.
FIGURE 5
FIGURE 5
EVO induced NOTCH3 methylation in NSCLC cells. (A) NOTCH3 methylation level in the normal and lung tumor tissues were checked and analyzed in TCGA from MethHC database. The dataset includes 422 cases of lung cancer patients and 21 cases of normal persons. (B) The accurate content of NOTCH3 methylated DNA were detected by MeDIP-qPCR in A549 and H1299 cells. (C) Cells were treated with EVO (4, 8, and 16 μM for A549 cells and 1, 2, and 4 μM for H1299 cells, respectively) for 48 h. Protein levels of DNMTs in these two cell lines were detected by Western blot analysis. In (B) and (C), Data were presented as mean ± SD from three independent experiments, p < 0.05, ∗∗p < 0.01,∗∗∗p < 0.001, vs. vehicle. (D) Quantitative methylation profiling of NOTCH3 promoter in A549 and H1299 cells were analyzed by MassARRAY system. Each experiment is repeated and performed in triplicate, and mean value quantification is presented in lower panel.
FIGURE 6
FIGURE 6
Inhibition of NOTCH3 methylation diminished EVO’s anti-lung cancer effects. (A) H1299 cells were treated with EVO (2 μM) in the presence or absence of 5-aza/TSA (2.5/0.5 μM) for 48 h. The protein levels of Notch3 in H1299 cells were detected by Western blot analysis. (B) Total mRNA was extracted by using real-time PCR analysis. (C) After fixation, cells were stained with PI and then analyzed using flow cytometry. Representative images (left) and the statistical analysis of cell cycle data in three independent experiments (right) were shown. (D) Cells were treated with different concentrations of EVO in the presence and absence of 5-aza/TSA (2.5/0.5 μM) for 48 h, cell viability was measured by the MTT assay. (E) Cells were treated as previously described in (A), then cells were extracted for Western blot analysis by using antibody specific to CD44. Protein level of the vehicle-treated cells was regarded as 1. Data were presented as mean ± SD from three independent experiments, p < 0.05, ∗∗p < 0.01 vs. vehicle; #p < 0.05, ##p < 0.01, ###p < 0.001 vs. EVO.

Similar articles

Cited by

References

    1. Alberg A. J., Brock M. V., Ford J. G., Samet J. M., Spivack S. D. (2013). Epidemiology of lung cancer: diagnosis and management of lung cancer, 3rd ed: American College of Chest Physicians evidence-based clinical practice guidelines. Chest 143 e1S–e29S. 10.1378/chest.12-2345 - DOI - PMC - PubMed
    1. Capelletti M., Gelsomino F., Tiseo M. (2014). MET and ALK as targets for the treatment of NSCLC. Curr. Pharm. Des. 20 3914–3932. 10.2174/13816128113196660760 - DOI - PubMed
    1. Cappuzzo F., Hirsch F. R., Rossi E., Bartolini S., Ceresoli G. L., Bemis L., et al. (2005). Epidermal growth factor receptor gene and protein and gefitinib sensitivity in non-small-cell lung cancer. J. Natl. Cancer Inst. 97 643–655. 10.1093/jnci/dji112 - DOI - PubMed
    1. Chong C. R., Janne P. A. (2013). The quest to overcome resistance to EGFR-targeted therapies in cancer. Nat. Med. 19 1389–1400. 10.1038/nm.3388 - DOI - PMC - PubMed
    1. Clement N., Gueguen M., Glorian M., Blaise R., Andreani M., Brou C., et al. (2007). Notch3 and IL-1beta exert opposing effects on a vascular smooth muscle cell inflammatory pathway in which NF-kappaB drives crosstalk. J. Cell Sci. 120 3352–3361. 10.1242/jcs.007872 - DOI - PubMed