. 2018 May 1:9:854.
doi: 10.3389/fmicb.2018.00854. eCollection 2018.

Evolutionary Analysis Provides Insight Into the Origin and Adaptation of HCV

Affiliations

Evolutionary Analysis Provides Insight Into the Origin and Adaptation of HCV

Diego Forni et al. Front Microbiol. .

Abstract

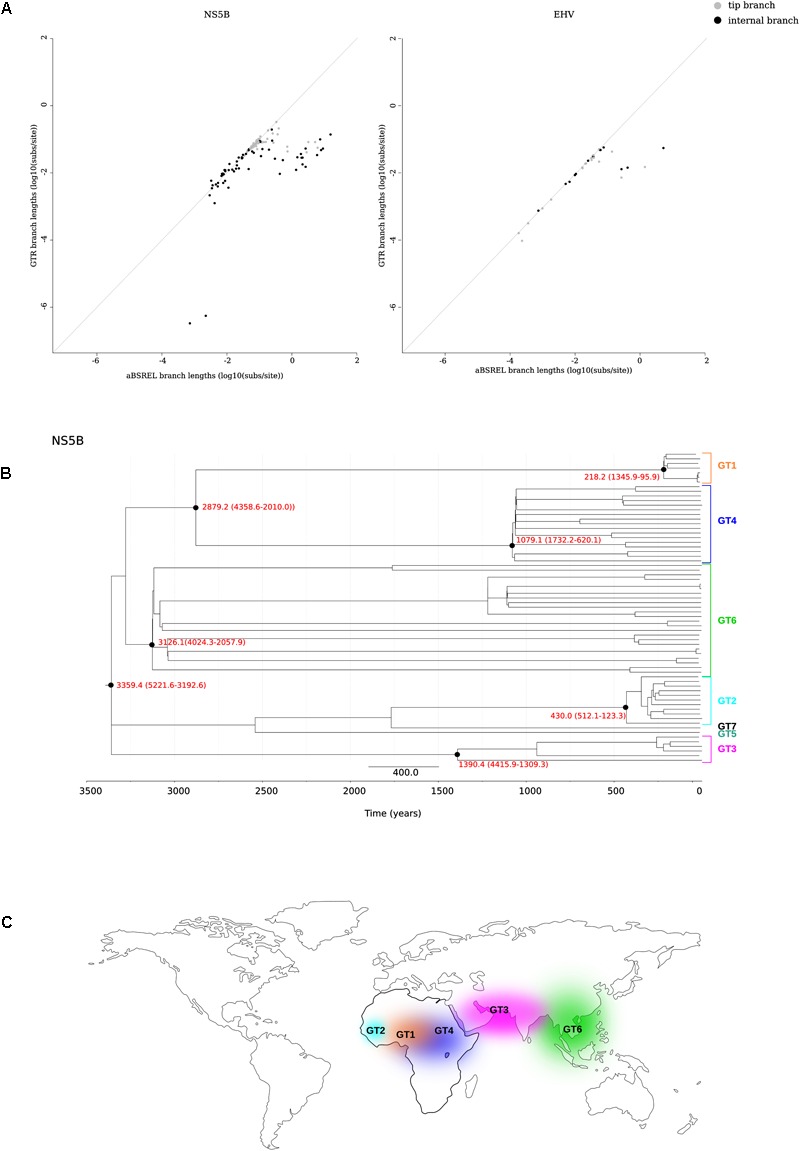
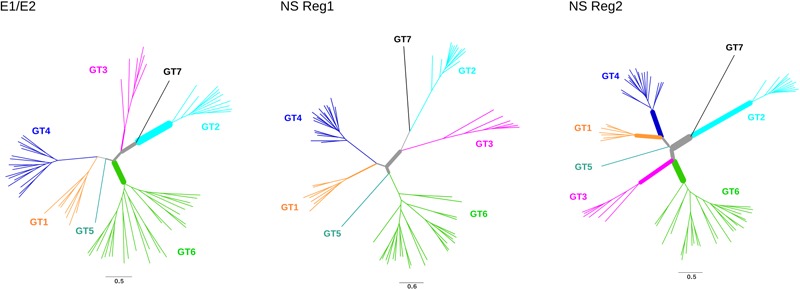
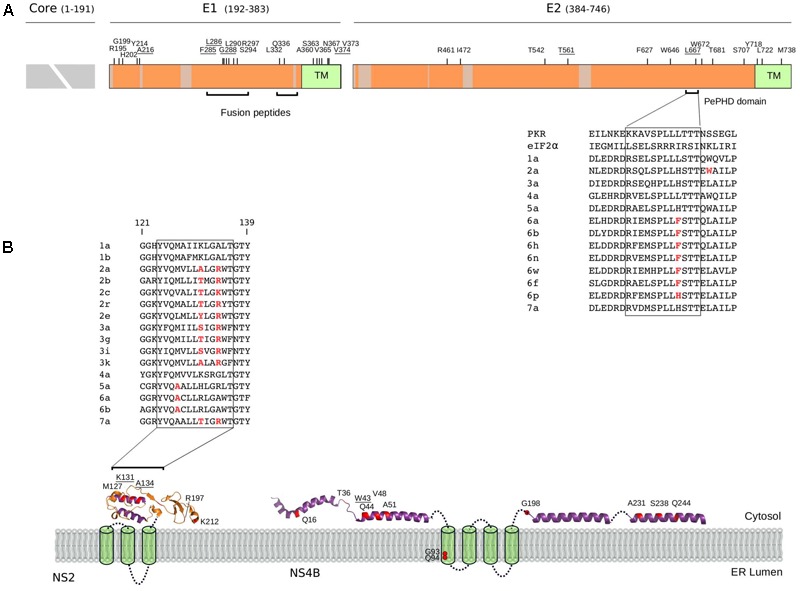
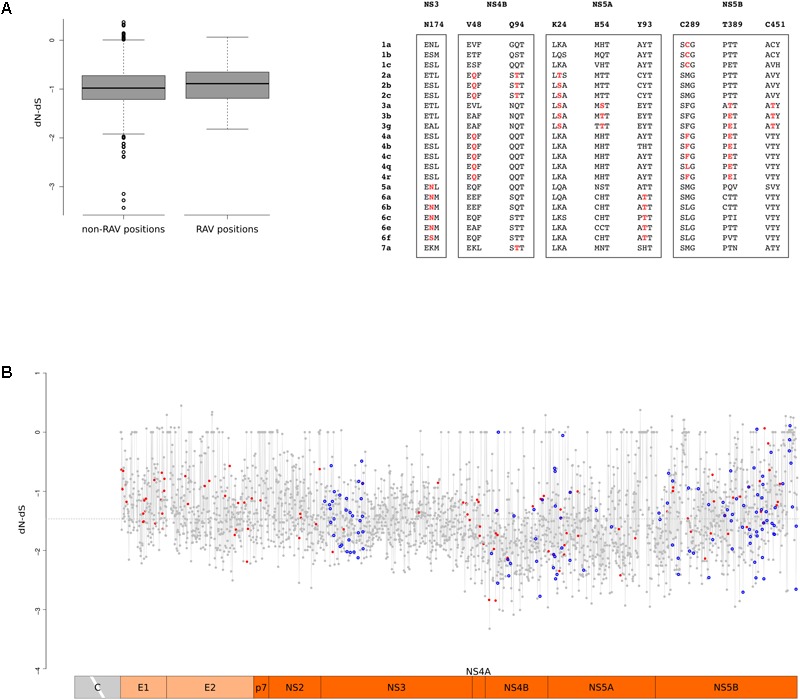
Hepatitis C virus (HCV) belongs to the Hepacivirus genus and is genetically heterogeneous, with seven major genotypes further divided into several recognized subtypes. HCV origin was previously dated in a range between ∼200 and 1000 years ago. Hepaciviruses have been identified in several domestic and wild mammals, the largest viral diversity being observed in bats and rodents. The closest relatives of HCV were found in horses/donkeys (equine hepaciviruses, EHV). However, the origin of HCV as a human pathogen is still an unsolved puzzle. Using a selection-informed evolutionary model, we show that the common ancestor of extant HCV genotypes existed at least 3000 years ago (CI: 3192-5221 years ago), with the oldest genotypes being endemic to Asia. EHV originated around 1100 CE (CI: 291-1640 CE). These time estimates exclude that EHV transmission was mainly sustained by widespread veterinary practices and suggest that HCV originated from a single zoonotic event with subsequent diversification in human populations. We also describe a number of biologically important sites in the major HCV genotypes that have been positively selected and indicate that drug resistance-associated variants are significantly enriched at positively selected sites. HCV exploits several cell-surface molecules for cell entry, but only two of these (CD81 and OCLN) determine the species-specificity of infection. Herein evolutionary analyses do not support a long-standing association between primates and hepaciviruses, and signals of positive selection at CD81 were only observed in Chiroptera. No evidence of selection was detected for OCLN in any mammalian order. These results shed light on the origin of HCV and provide a catalog of candidate genetic modulators of HCV phenotypic diversity.

Keywords: CD81; equine hepacivirus; hepatitis C virus; molecular dating; positive selection; resistance-associated amino acid variants; tMRCA.


Figures

FIGURE 1
FIGURE 1
Positively selected sites in CD81. The membrane topology of CD81 is shown. Positions involved in HCV binding and/or infectivity are highlighted in yellow, both on the structure (circle) and on the protein alignment. Positively selected sites Chiroptera are indicated in red. LEL: large extracellular loop; SEL: short extracellular loop. Positions refer to the human sequence (Accession ID: NM_004356).
FIGURE 2
FIGURE 2
tMRCA estimation. (A) Comparison of branch lengths obtained using the aBS-REL and the GTR models for the NS5B abd EHV phylogenies. (B) Timescaled phylogenetic tree estimated for 67 HCV subtypes. The scale bar below the phylogeny represents years before present. The tMRCAs of analyzed nodes are reported in red with 95% confidence intervals. (C) Geographic distribution of HCV endemic transmissions (Simmonds, 2013).
FIGURE 3
FIGURE 3
Positive selection in HCV phylogenies. Maximum-likelihood phylogenetic trees for E1/E2 region, non-structural (NS) region 1, and non-structural region 2. Branch thickness is proportional to the number of positively selected sites. Branch lengths are proportional to the number of nucleotide substitutions per site.
FIGURE 4
FIGURE 4
Selected sites in HCV proteins. (A) Schematic representation of the HCV structural region. Regions that were not analyzed (i.e., core region) or filtered due to poor alignment quality are colored in gray. The location of positively selected sites is shown and residues with known functional significance (see text and below) are underlined. Sites are numbered based on the sequence of the H77 strain (AF009606.1). The ectodomain region of E1 contains two short regions with sequence similarity to class II fusion peptides (Drummer et al., 2007): in vitro mutagenesis indicated that changes at positively selected residues 285, 286, and 288 abolish or reduce viral entry (Drummer et al., 2007; Li et al., 2009; Russell et al., 2009). A 12 amino acid motif in E2 (the PKR-eIF2α phosphorylation site homology domain, PePHD) is required for PKR and PERK (PKR-like ER-resident kinase) inhibition (Taylor et al., 1999; Pavio et al., 2003). An amino acid alignment for the PePHD domain is reported (representative HCV sequences only), with positively selected sites in red. TM: transmembrane domain. (B) Topological structure of the NS2 and NS4B proteins. Positively selected sites are mapped (red) on the NS2 (PDB ID: 2HD0) and NS4B (PDB ID: 2LVG, 2JXF, 2KDR) protein structures. Protein segments of unresolved structure are represented as cylinders (transmembrane domains) or dotted lines. An amino acid alignment of the second amphipathic helix of NS2 is reported for representative strains (positively selected sites in red): mutagenesis of positively charged residues at positions 131 or 134 (depending on the genotype) affect NS2 membrane association, protein stability, and efficient HCV polyprotein processing (Lange et al., 2014). The presence of at least one positively charged residue at these positions is sufficient to allow proper membrane localization (Lange et al., 2014) and indeed, the two positions evolve in concert in the HCV phylogeny with a charged residue always observed at either position 131 or 134, but never at both sites. ER: Endoplasmic reticulum.
FIGURE 5
FIGURE 5
NS5A/NS5B selection at the binding interface. (A) Schematic representation of the HCV NS5A protein. Regions that were filtered due to poor alignment quality are colored in gray. The location of positively selected sites is shown and residues discussed in the text are underlined. Positions 68 and 69 are also underlined, as a single lysine insertion between these two sites strongly increases viral replication (Pflugheber et al., 2002). (B) Superimposition of NS5A-OAS1 binding pose obtained using two different docking programs. For clarity, one OAS1 molecule is shown (green); the binding poses of the NS5A dimer obtained with ClusPro (yellow) and PatchDock (light orange) are shown. The F37 residue, known to modulate NS5A binding to OAS1, is marked in orange. Positively selected sites are in red and labeled based on the sequence of H77. OAS1 regions that are essential for NS5A binding are in dark green. (C) World map showing rs12979860 allele frequency in human populations (data from https://www.ncbi.nlm.nih.gov/variation/tools/1000genomes/ and https://alfred.med.yale.edu/alfred/highThroughPut.asp). (D) Docking pose of NS5B (PDB ID: 4MK7, white) with sphingomyelin (green). Positively selected sites are colored in red and labeled when located at the NS5B-sphingomyelin binding interface. (E) Ligand interaction diagram of best docked pose of NS5B-sphingomyelin. Residues within a 6Å distance and hydrogen bonds are shown (see legend).
FIGURE 6
FIGURE 6
RAV evolution. (A) Standard box-and-whisker plot representation (thick line: median; box: quartiles; whiskers: 1.5 × interquartile range) of dN-dS (SLAC method) at RAV and non-RAV positions. Positively selected RAVs are shown with two flanking amino acid residues for few representative HCV subtypes. RAVs are in red depending on the branch they are selected on. (B) Plot of dN-dS (SLAC method) across the HCV genome (with the exclusion of the core region). Positively selected sites are denoted with a red dot and RAVs with a blue circle. The dashed line represents the median value. Positions refer to the H77 strain (AF009606.1).

Similar articles

Cited by

References

    1. Aiewsakun P., Katzourakis A. (2016). Time-dependent rate phenomenon in viruses. J. Virol. 90 7184–7195. 10.1128/JVI.00593-16 - DOI - PMC - PubMed
    1. Akamatsu S., Hayes C. N., Ochi H., Uchida T., Kan H., Murakami E., et al. (2015). Association between variants in the interferon lambda 4 locus and substitutions in the hepatitis C virus non-structural protein 5A. J. Hepatol. 63 554–563. 10.1016/j.jhep.2015.03.033 - DOI - PubMed
    1. Anisimova M., Bielawski J. P., Yang Z. (2001). Accuracy and power of the likelihood ratio test in detecting adaptive molecular evolution. Mol. Biol. Evol. 18 1585–1592. 10.1093/oxfordjournals.molbev.a003945 - DOI - PubMed
    1. Anisimova M., Bielawski J. P., Yang Z. (2002). Accuracy and power of Bayes prediction of amino acid sites under positive selection. Mol. Biol. Evol. 19 950–958. 10.1093/oxfordjournals.molbev.a004152 - DOI - PubMed
    1. Ansari M. A., Pedergnana V., L C Ip C., Magri A., Von Delft A., Bonsall D., et al. (2017). Genome-to-genome analysis highlights the effect of the human innate and adaptive immune systems on the hepatitis C virus. Nat. Genet. 49 666–673. 10.1038/ng.3835 - DOI - PMC - PubMed