. 2018 Apr;14(3):655-670.
doi: 10.5114/aoms.2017.69771. Epub 2017 Sep 5.

Ringer's lactate solution enhances the inflammatory response during fluid resuscitation of experimentally induced haemorrhagic shock in rats

Affiliations

Ringer's lactate solution enhances the inflammatory response during fluid resuscitation of experimentally induced haemorrhagic shock in rats

Krzysztof Kusza et al. Arch Med Sci. 2018 Apr.

Abstract

Introduction: Hemorrhagic shock leads to systemic oxygen deficit (hypoxaemia) that results in systemic inflammatory response syndrome (SIRS), a recognised cause of late mortality in this case. The aim of this study was to analyse the impact of fluid resuscitation, using two Ringer solutions, on the microcirculation changes that take place during experimentally induced haemorrhagic shock.

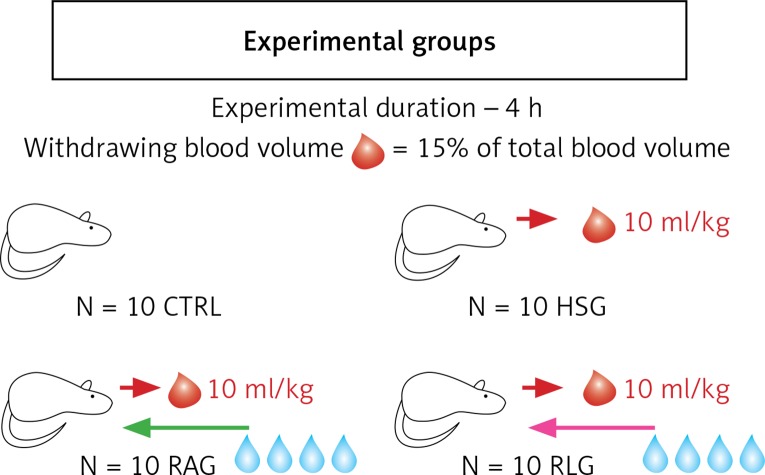
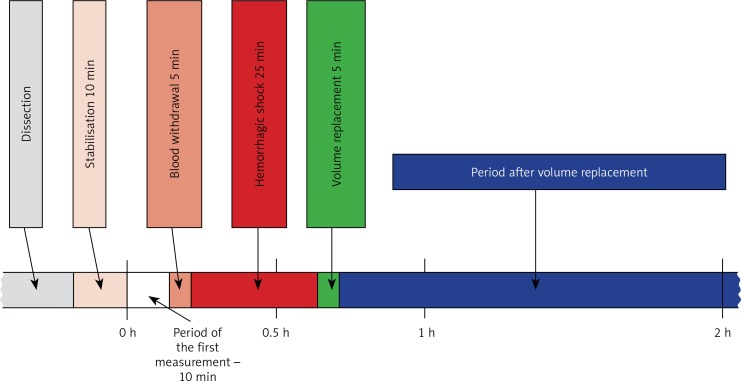
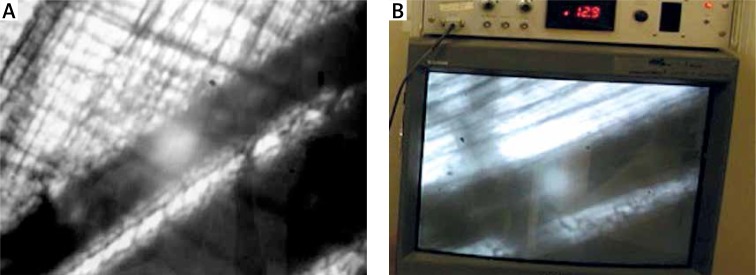
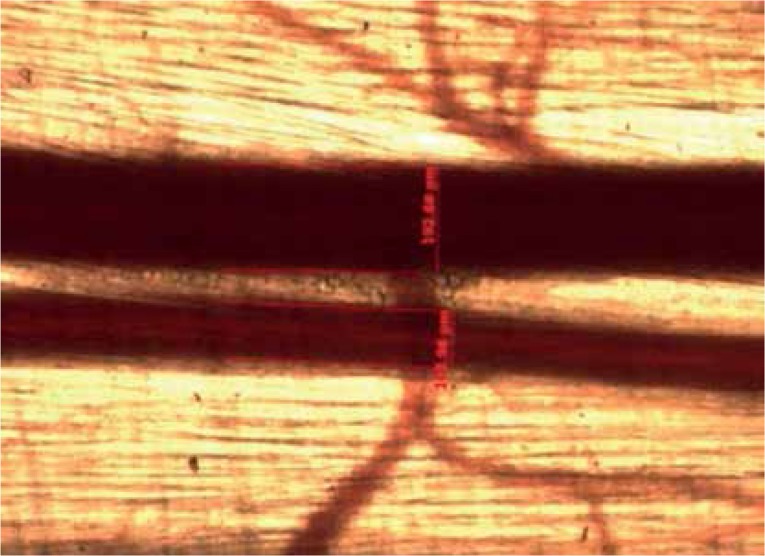
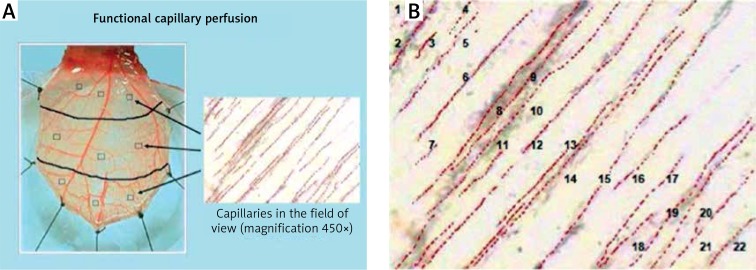
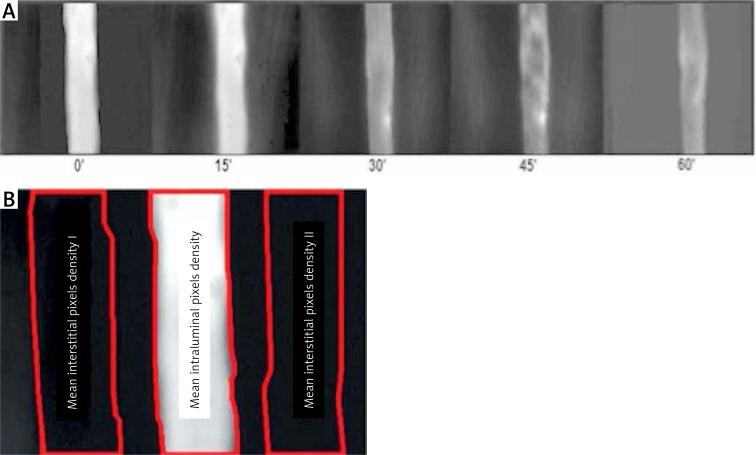
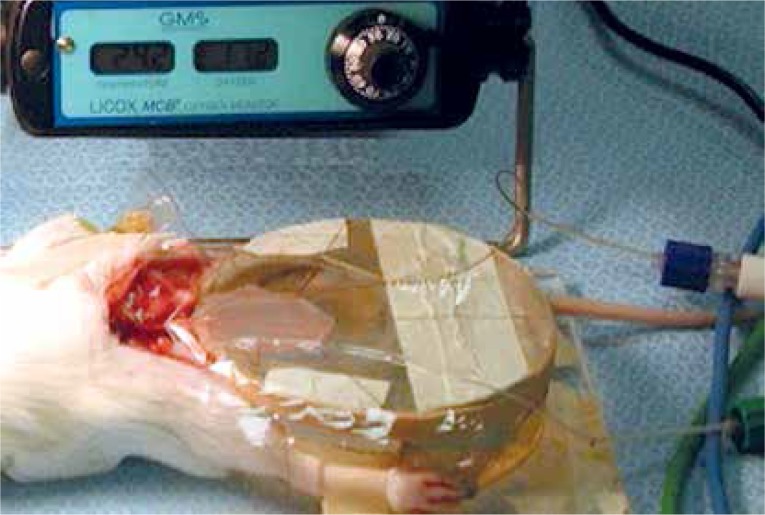
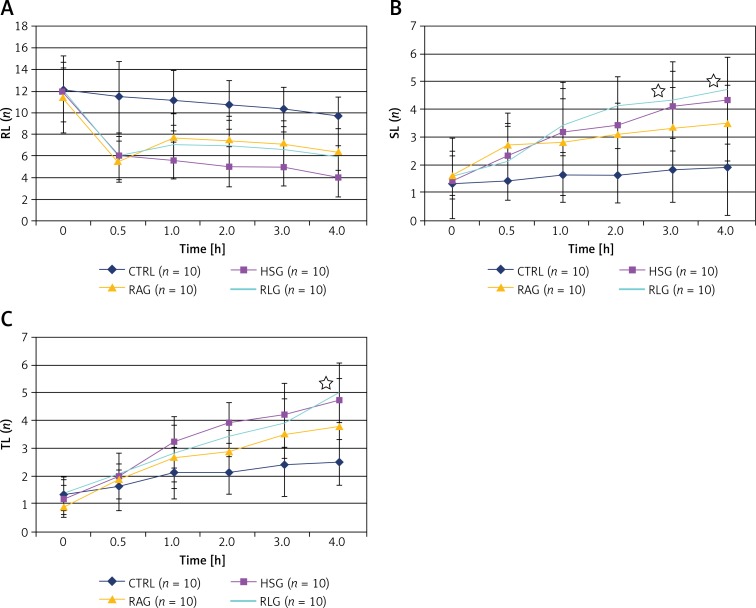
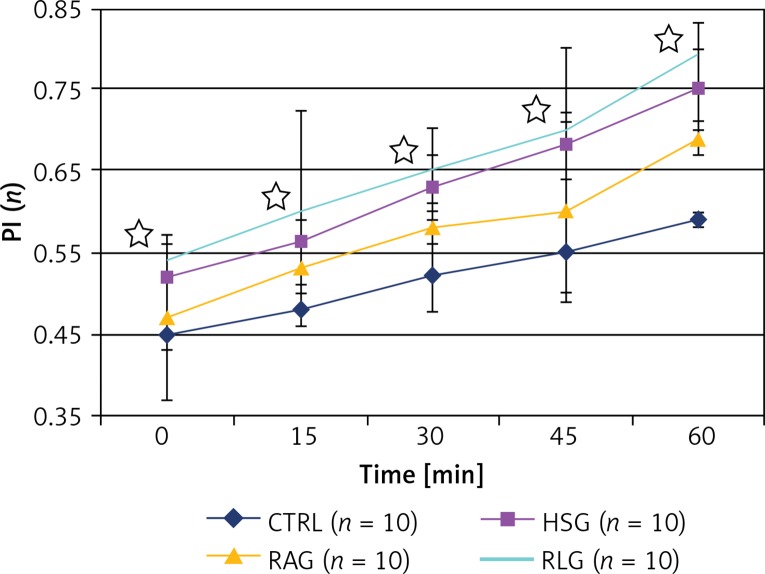
Material and methods: A model of the rat cremaster muscle was used to assess microcirculation in vivo. The experimental groups (n = 10 each) included: control (CTRL); shock (HSG); Ringer's acetate (RAG); and Ringer's lactate (RLG). Microhaemodynamic parameters were measured during the experiment.

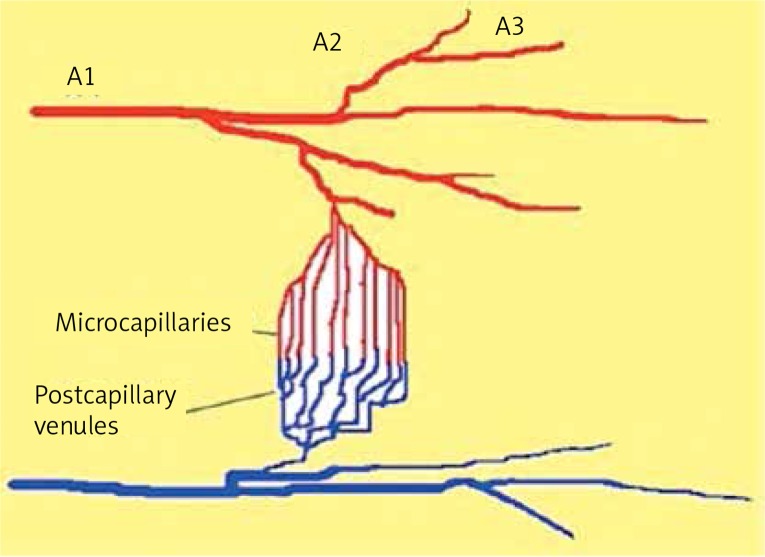
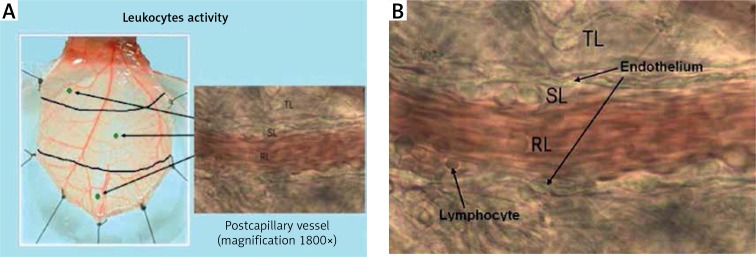
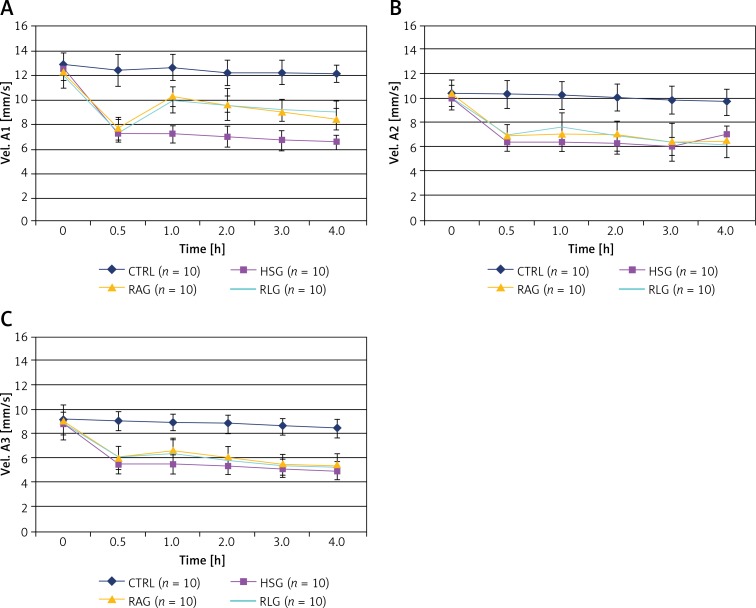
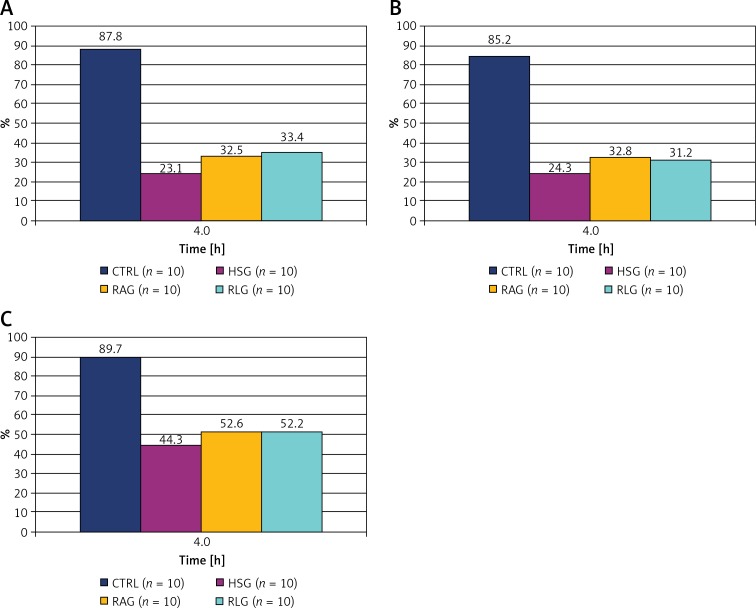
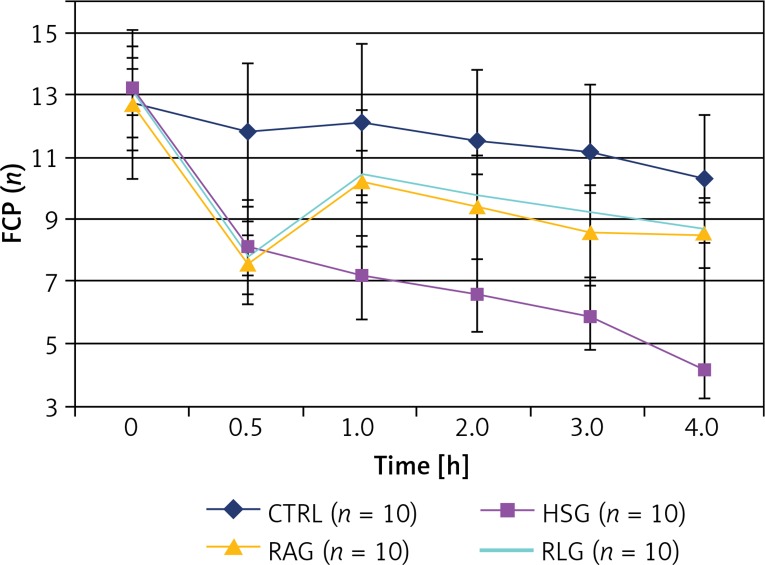
Results: A statistically significantly higher level of leukocytes, both those attached to the endothelium and those located in the extravascular space (p < 0.05), was reported in the lactate Ringer (LR) group compared with the AR group. There were significant differences in the activity of A3 arterioles compared with A1 and A2 arterioles. Ringer's lactate solution seemed to the inflammation response during fluid resuscitation from haemorrhagic shock. A3 arterioles are likely to play a role as a pre-capillary sphincter in the skeletal muscle.

Conclusions: The present study revealed that fluid resuscitation with Ringer's lactate solution exacerbates inflammation in the skeletal muscle. It is worth noting that Ringer's acetate solution reduces local inflammation and could therefore be recommended as the "first line" crystalloid of the fluid resuscitation during haemorrhagic shock.

Keywords: Ringer’s lactate solution; fluid resuscitation; haemorrhagic shock; rat.


Figures

Figure 1
Figure 1
Diagram showing four experimental groups (CTRL, HSG, RAG, RLG) of 10 animals each. Red arrows show collected blood volume of 10 ml/kg during induction of haemorrhagic shock. The green arrow shows the Ringer’s acetate solution infusion to RAG group animals in a volume of 40 ml/kg, during resuscitation of haemorrhagic shock. Pink arrow shows in analogy to the previous group, infusion of Ringer’s lactate solution in RLG in a volume of 40 ml/kg (description in text)
Figure 2
Figure 2
Illustration of the experimental protocol # ARC 08343, approved by the Institutional Animal Care and Use Committee, Cleveland Clinic, USA
Figure 3
Figure 3
A – Measurement of red blood cell velocity. On the picture are visualized capillaries running in the vicinity of two blood vessels (arterial and venous). Examined arterial vessel was marked using an optical pointer (white point). Visibly on the monitor, pulsed flow (characteristic for the artery) was accompanied by an oscillating acoustic effect of high frequency. B – Monitor connected to the Optical Doppler Velocimeter device. The red blood cell velocity (RBC) measurements of the arterioles were displayed on the monitor of the measuring device (Optical Doppler velocimeter, Texas A & M University, Glaveston, TX) in mm/s
Figure 4
Figure 4
Diagram showing the areas of cremaster muscle microcirculation which were analysed in the experimental study. A1, A2, A3 arterioles – vessel diameters, and red blood cell velocity of the arterioles were measured; capillaries – the number of perfused capillary vessels were studied in the power field of view (FCP); post-capillary venule-neutrophil-endothelial interactions and vascular permeability (PI) were measured (description in text)
Figure 5
Figure 5
Measurements of blood vessel diameters. Blood vessels of cremaster muscle appear on the Axiocam MR measurement system screen: venous (V1) (measurements were not analysed in the experiment), and arterial (A1). Results of blood vessel measurements were presented on the screen in a numerical value in μm
Figure 6
Figure 6
A – Measurement of FCP. The number of capillaries with undisturbed flow within the lumen was counted in the selected fields of the muscle; the three fields in proximal, middle and distal parts of the muscle adjacent to randomly selected post‑capillary venules were chosen. B – In this field of view, 22 perfused capillaries are identified. Erythrocytes are visible in the lumen of the capillary vessels subjected to flow
Figure 7
Figure 7
A – Evaluation of leukocyte activation. The behaviour of the leukocytes was assessed in one randomly selected post‑capillary venule in each of the proximal, middle and distal region of the cremaster muscle. B – Assessment of leukocytes’ presence in the post‑capillary venule (magnification 1800×). In the course of the experimental design measurements of the leukocytes were taken including: the number of leukocytes moving freely through the vessel (RL), the number of leukocytes attached to the vascular endothelium for more than 20 s (SL), and the number of leukocytes located in the extravascular space (TL)
Figure 8
Figure 8
A – Fluorescence microscopy. FITC-albumin molecules are visible in the post‑capillary vessel lumen as the white column. Transition of FITC-labelled albumin from the lumen into the extravascular space is visible as white streaks on both sides of the post‑capillary venule lumen. Images were taken at 15-minute intervals at the 5th h of the experiment. 0’ – photo taken immediately after injection of FITC-albumin, 15’, 30’, 60’ – pictures taken respectively at 15, 30, 45, and 60 min after injection of FITC-labelled albumin. B – Images of post‑capillary venules collected during the fluorescence microscopy were analysed using Image Pro-Plus software. The area of bright vessel’s part was outlined and then analysed as the intravascular space (IVS). On both sides of the post‑capillary venule similar in size and shaped areas of the extravascular space (ISS) were outlined. Average optical density of the analysed areas was calculated, and then the ISS to IVS ratio was calculated as the endothelial permeability index (PI)
Figure 9
Figure 9
Measurement of tissue oxygenation. Figure shows the dissected rat cremaster muscle, spread on the plexiglass chamber. The oxygen micro sensor Licox measuring device (Integra, NJ) was placed underneath the muscle
Figure 10
Figure 10
A – Comparison of measurements of red blood cell velocity in A1 (Vel A1) arterioles within the studied experimental groups (CTRL, HSG, RAG, RLG). B – Comparison of measurements of red blood cell velocity in A2 (Vel A2) arterioles within the studied experimental groups (CTRL, HSG, RAG, RLG). C – Comparison of measurements of red blood cell velocity in A3 (Vel A3) arterioles within the studied experimental groups (CTRL, HSG, RAG, RLG)
Figure 11
Figure 11
Percentage change in flows value in the fourth hour of the experiment, for A1 arterioles (A), A2 arterioles (B) and A3 arterioles (C) respectively. The 100% values were assumed the baseline flow at the beginning of the experiment (time “0”) within each group
Figure 12
Figure 12
Comparison of the measured FCP (functional capillary perfusion) values within the studied experimental groups (CTRL, HSG, RAG, RLG)
Figure 13
Figure 13
A – Comparison of measurements of freely flowing leukocytes (RL, rolling leukocytes) within the studied experimental groups (CTRL, HSG, RAG, RLG). B – Comparison of measurements of the number of leukocytes attached to the endothelium (SL, sticking leukocytes) within the studied experimental groups (CTRL, HSG, RAG, RLG). Statistically significant differences in the amount of SL between RLG and RAG groups are indicated with stars. C – Comparison of measurements of the number of leukocytes in the extravascular space (TL, transmigrated leukocytes) within the studied experimental groups (CTRL, HSG, RAG, RLG). Statistically significant difference in the amount of SL between RAG and RLG groups is indicated with a star
Figure 14
Figure 14
Comparison of results of permeability index (PI) within the studied experimental groups (CTRL, HSG, RAG, RLG). Statistically significant differences (p < 0.05) in PI values between RAG and RLG groups are indicated with stars

References

    1. Baue AE. MOF, MODS, and SIRS: what is in a name or an acronym? Shock. 2006;26:438–49. - PubMed
    1. Deitch EA. Multiple organ failure. Pathophysiology and potential future therapy. Ann Surg. 1992;216:117–34. - PMC - PubMed
    1. Jaeschke H, Bautista AP, Spolarics Z, et al. Superoxide generation by neutrophils and Kupffer cells during in vivo reperfusion after hepatic ischemia in rats. J Leukoc Biol. 1992;52:377–82. - PubMed
    1. Paes-da-Silva F, Gonzalez AP, Tibirica E. Effects of fluid resuscitation on mesenteric microvascular blood flow and lymphatic activity after severe hemorrhagic shock in rats. Shock. 2003;19:55–60. - PubMed
    1. Lee CC, Chang IJ, Yen ZS, et al. Effect of different resuscitation fluids on cytokine response in a rat model of hemorrhagic shock. Shock. 2005;24:177–81. - PubMed