. 2018 Apr 20;9(30):21141-21155.
doi: 10.18632/oncotarget.24975.

Esophageal cancer cells resistant to T-DM1 display alterations in cell adhesion and the prostaglandin pathway

Affiliations

Esophageal cancer cells resistant to T-DM1 display alterations in cell adhesion and the prostaglandin pathway

Juliette Sauveur et al. Oncotarget. .

Abstract

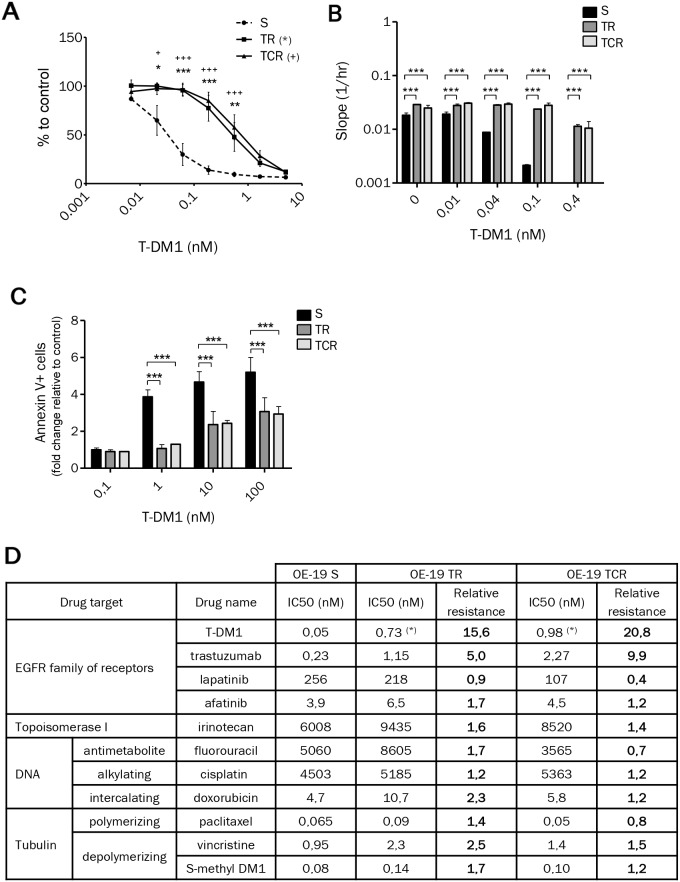
Trastuzumab-emtansine (T-DM1) is an antibody-drug conjugate that specifically targets HER2 thanks to its antibody component trastuzumab. In spite of responses to this novel agent, acquired resistance to treatment remains a major obstacle. Prolonged in vitro exposure of the gastroesophageal junction cancer cell line OE-19 to T-DM1, in the absence or presence of ciclosporin A resulted in the selection of two resistant cell lines to T-DM1. T-DM1-resistant cells presented an increased expression of adhesion genes, altered spreading and higher sensitivity to anoikis than parental cells. A resistant cell line showed decreased adhesion strength, increased migration speed and increased sensitivity to RhoA inhibition. Genes involved in the prostaglandin pathway were deregulated in resistant models. Addition of prostaglandin E2 to T-DM1 partially restored its cytotoxic activity in resistant models. This work demonstrates that T-DM1-resistance may be associated with alterations of cell adhesion and the prostaglandin pathway, which might constitute novel therapeutic targets.

Keywords: HER2; T-DM1; esophageal cancer; focal adhesions; resistance.


Conflict of interest statement

CONFLICTS OF INTEREST CD received research funding from Roche France.

Figures

Figure 1
Figure 1. Chronic exposure to T-DM1 of OE-19 cell line results in resistance to this immunoconjugate
(A) Cytotoxicity of T-DM1 on OE-19 S, TR and TCR cells determined by MTT cytotoxic assays revealed an increase in the IC50 of TR and TCR cells compared to parental cells. (B) Cytotoxicity of T-DM1 was studied using xCELLigence. The cell index slope was calculated using RTCA software and plotted. A single experiment is shown, representative of 3 experiments. The stronger the slope, the stronger the cell proliferation. (C) Cell death after 72h exposure to T-DM1 was assessed by annexin V staining using flow cytometry. The fold change in cell death relative to control was plotted for each cell line. The amount of cell death was decreased in TR and TCR compared to parental cells. Statistically significant differences were found for TR (***: P<0,001; **: P<0,01; *: P<0,05) and TCR (+) compared to S cells. (D) Parental and resistant OE-19 cells were exposed to the indicated anti-cancer agents and their sensitivity was assessed by MTT assay (or xCELLigence for trastuzumab). Data are shown as the mean IC50 calculated from 3-4 independent experiments and the relative resistance is the ratio of the IC50 for OE-19 TR or TCR over the IC50 for OE-19 S cell line (*: p<0,05).
Figure 2
Figure 2. ABC transporters MDR1 and BCRP expression and activity are not significantly modified in resistance models
(A) Surface expression of MDR1 and BCRP, studied by flow cytometry, does not show an increased expression of these ABC transporters in resistant cells. (B) Efflux activity was determined by Rhodamine 123 (Rho123) accumulation using flow cytometry. Rho123 efflux percent was not significantly different in resistant cells and in parental cells. The percentage of Rho123 efflux was calculated by comparing the mean fluorescence intensity (MFI) after uptakeand the MFI after efflux ((Uptake-Efflux)/Uptake*100).
Figure 3
Figure 3. HER2 expression remains unchanged after chronic exposure to T-DM1
(A) mRNA and (B) proteinexpression from total cell lysates show that HER2 levels are unaffected in resistant cells. (C) HER2 expression at the cell surface determined by flow cytometry shows that parental and resistant cells express the same amount of HER2. (D) After exposure to T-DM1 for 1h at 4°C, cells were stained with anti-Kappa antibody and the mean fluorescence intensity (MFI) was studied using flow cytometry. T-DM1 was found to bind similarly parental and resistant cells. A single experiment is shown, representative of 3 experiments.
Figure 4
Figure 4. T-DM1-induced cell cycle arrest is impaired in OE-19 TR and TCR compared to OE-19 S
(A) Exposure to increasing concentrations of T-DM1 for 24h and analysis of cell cycle distribution shows that the G2/M population was decreased in resistant cells compared to parental. Statistically differences are shown for TR (***: P<0,001; *: P<0,05) and TCR (+++: P<0,001) compared to S. (B) Cell cycle distribution was studied by propidium iodide staining using flow cytometry after 24h exposure to 1 μM vincristine or 10 nM S-methyl DM1. Control conditions are not shown; only OE-19 S, TR and TCR exposed to drugs are plotted. Vincristine and S-methyl DM1 induced G2/M phase arrest in parental and resistant cells. The TCR cell line showed decreased sensitivity to cell cycle arrest in comparison to the parental cell line (*: P<0,05; **: P<0,01).
Figure 5
Figure 5. Tubulin expression and polymerized/soluble tubulin fractions in resistant models
Expression of total α and β tubulin and isoforms βII and βIII was examined from total cell lysates or from purified fractions of tubulin. A single experiment is shown, representative of 3 experiments. (A) Protein levels from total cell lysate were studied by Western Blot and the density of the bands was normalized with actin to determine the expression fold-change. Cells resistant to T-DM1 express higher levels of βII and βIII tubulin than parental cells. (B) Protein expression after purification of polymerized (microtubule fraction) and soluble (free tubulin fraction) tubulin. The percentage of polymerized tubulin indicated on the Supplementary Figure hows that TR cells have an increased amount of polymerized tubulin compared to parental. (C) Acetylation, tyrosination and detyrosination state of α tubulin was studied by Western Blot. (D) Immunostaining of tubulin was performed in parental and resistant cells with or without exposure to T-DM1. Exposure to Taxol is shown as a positive control. Tubulin staining shows that the tubulin network is less sensitive to disruption by T-DM1 in resistant cells that sensitive cells.
Figure 6
Figure 6. Morphology is modified in both resistant cell lines but only TCR cells have increased migration speed and decreased adhesion strength
(A) Immunofluorescence staining of α-tubulin (green) and DAPI (blue) observed by confocal microscopy shows morphological differences between parental and T-DM1-resistant cell lines. (B) Migration speed determined by wound healing assay shows an increase in TR and TCR cells compared to parental (C) Immunofluorescence staining of talin (green) and DAPI (blue) observed using a confocal microscope. Focal adhesions in parental cells appear bigger and in least amount that those in resistant cells. (D) Detached fraction of parental and resistant cells following detachment by centrifugal force shows a decreased adhesion strength in TCR cells (*: P<0,05; P<0,01). (E) Cell death was quantified by Annexin/PI staining following 24h and 48h of incubation in suspension conditions. The percent of living cells was decreased in TR cells at 24h (P<0,01) and in TCR cells after 24h (P<0,001) and 48h (P<0,01) compared to parental. (F) Sensitivity to rhosin, bortezomib and fasudil was studied using MTT cytotoxic assays after 6 days exposure to the corresponding cytotoxic agents. Sensitivty to rhosin was increased in TCR cells compared to parental (**:P<0,01).
Figure 7
Figure 7. Prostaglandin E2 mediates sensitivity to T-DM1 in resistant cells
(A) The expression of genes involved in the prostaglandin pathway is highly modified in resistant cells to T-DM1. The results shown are the expression fold changes of TR or TCR over parental cells for the indicated genes determined by RT-qPCR. (B) Sensitivity to aspirin studied by MTT assay was found to be increased in TR and TCR cells compared to S cells (*: P<0,05; **: P<0,01). (C) Quantification by ELISA of PGE2 in the supernatant of each cell line shows an increased amount in TR cells compared to parental cells. (D) Wound healing assay performed on OE-19 S, TR and TCR cell lines in the absence or presence of 10 μM PGE2. The addition of PGE2 decreased the migration speed of the parental cell line but had no effect on the migration speed of both resistant cell lines. (E) Cell survival after exposure to 1 nM T-DM1 and 10 μM PGE2 was studied by Annexin V/PI staining after 72h exposure. The presence of PGE2 increases the sensitivity to T-DM1 of resistant models. (F) The increased sensitivity to T-DM1 in the presence of PGE2 was confirmed by xCELLigence. After overnight incubation cells were exposed to 1 μM PGE2 and/or 0,1 nM T-DM1. The normalized cell index of TR and TCR cells exposed to T-DM1 and PGE2 is inferior to control, PGE2 and T-DM1.A single experiment is shown, representative of 3 experiments.

References

    1. Slamon DJ, Clark GM, Wong SG, Levin WJ, Ullrich A, McGuire WL. Human breast cancer: correlation of relapse and survival with amplification of the HER-2/neu oncogene. Science. 1987;235:177–82. - PubMed
    1. Slamon DJ, Godolphin W, Jones LA, Holt JA, Wong SG, Keith DE, Levin WJ, Stuart SG, Udove J, Ullrich A. Studies of the HER-2/neu proto-oncogene in human breast and ovarian cancer. Science. 1989;244:707–12. - PubMed
    1. Kamangar F, Dores GM, Anderson WF. Patterns of cancer incidence, mortality, and prevalence across five continents: defining priorities to reduce cancer disparities in different geographic regions of the world. J Clin Oncol. 2006;24:2137–50. - PubMed
    1. Cunningham SC, Kamangar F, Kim MP, Hammoud S, Haque R, Maitra A, Montgomery E, Heitmiller RE, Choti MA, Lillemoe KD, Cameron JL, Yeo CJ, Schulick RD. Survival after gastric adenocarcinoma resection: eighteen-year experience at a single institution. J Gastrointest Surg. 2005;9:718–25. - PubMed
    1. Van Cutsem E, Bang YJ, Feng-Yi F, Xu JM, Lee KW, Jiao SC, Chong JL, López-Sanchez RI, Price T, Gladkov O, Stoss O, Hill J, Ng V, et al. HER2 screening data from ToGA: targeting HER2 in gastric and gastroesophageal junction cancer. Gastric Cancer. 2015;18:476–84. - PMC - PubMed