. 2018 Apr 20;9(30):21444-21458.
doi: 10.18632/oncotarget.25118.

Functional significance of co-occurring mutations in PIK3CA and MAP3K1 in breast cancer

Affiliations

Functional significance of co-occurring mutations in PIK3CA and MAP3K1 in breast cancer

Alvaro Avivar-Valderas et al. Oncotarget. .

Abstract

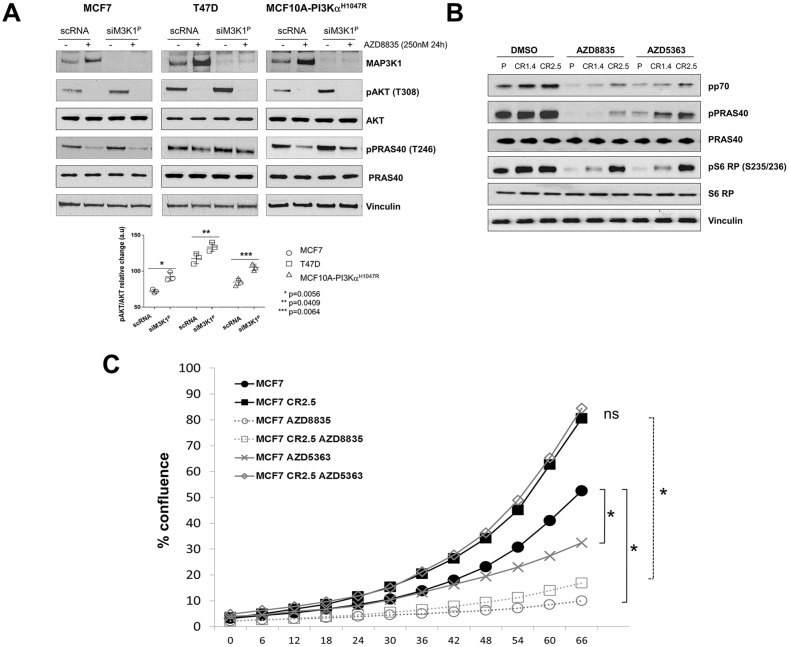
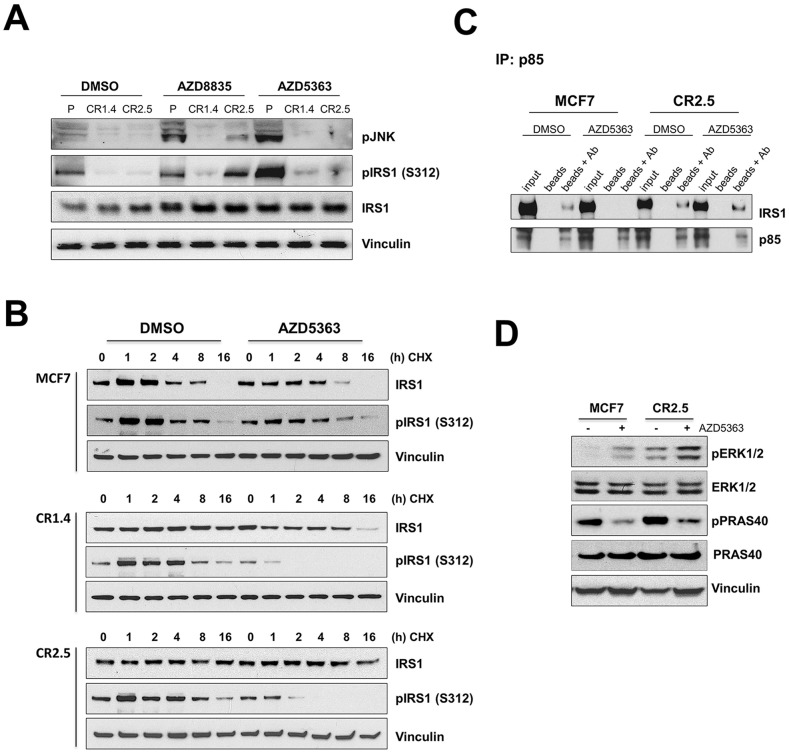
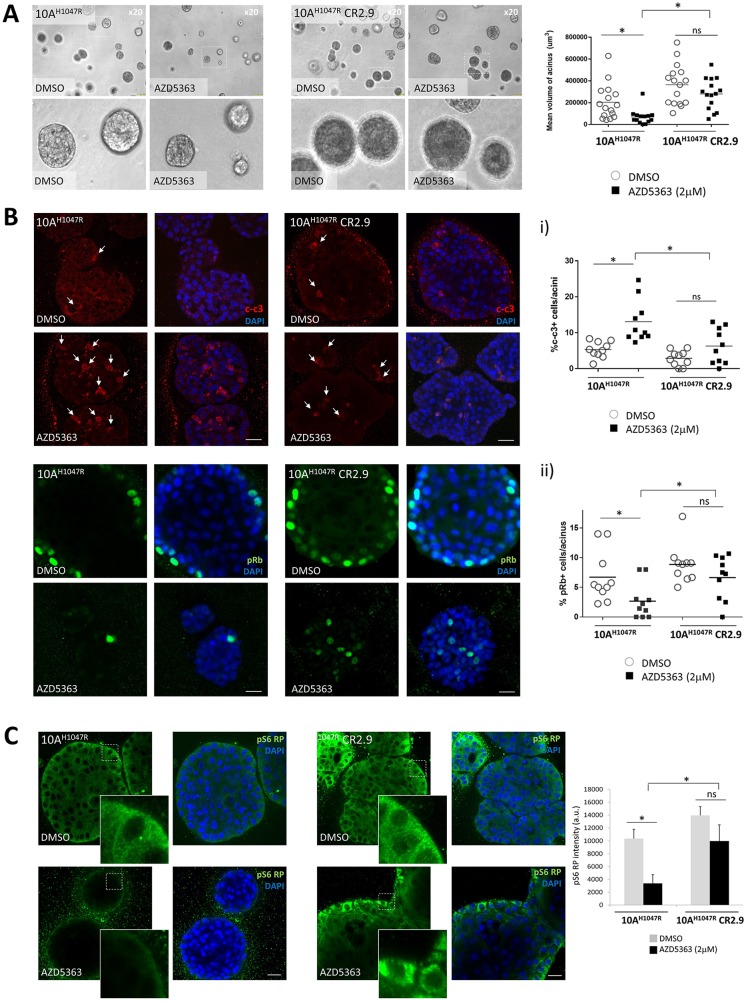
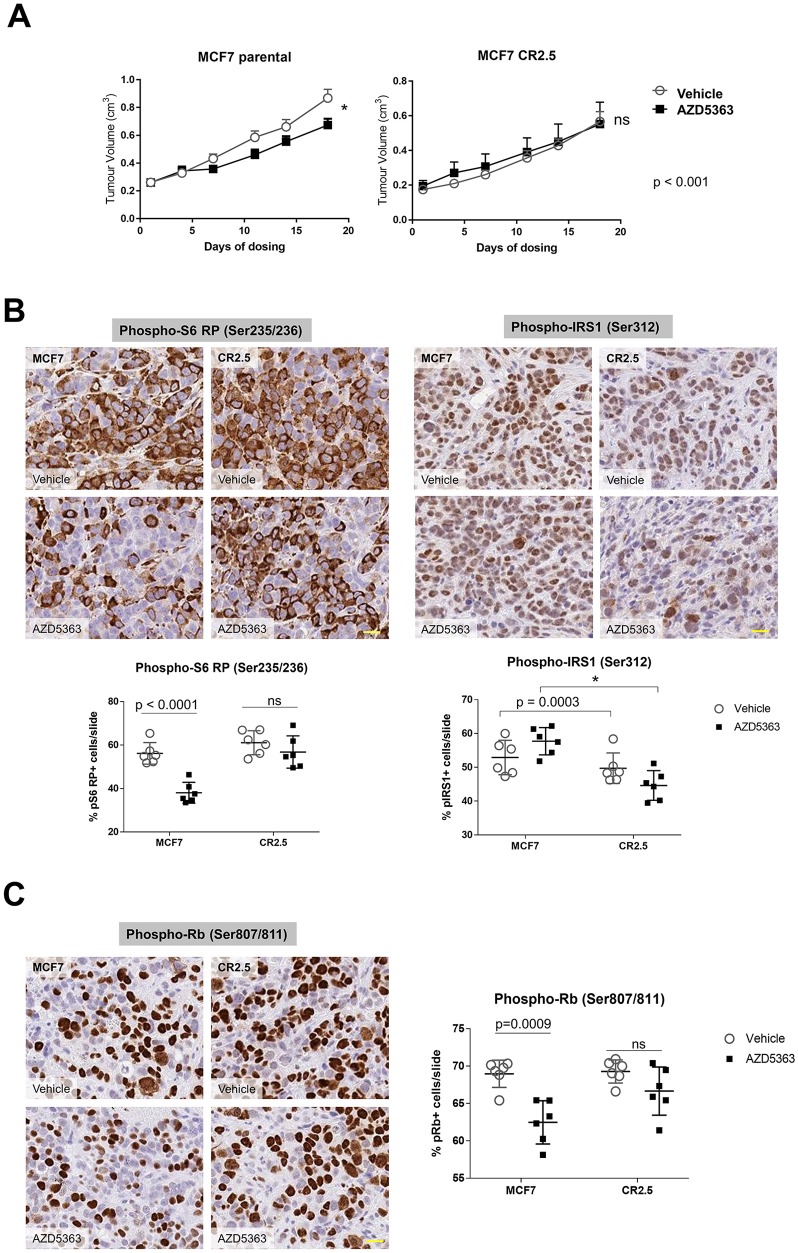
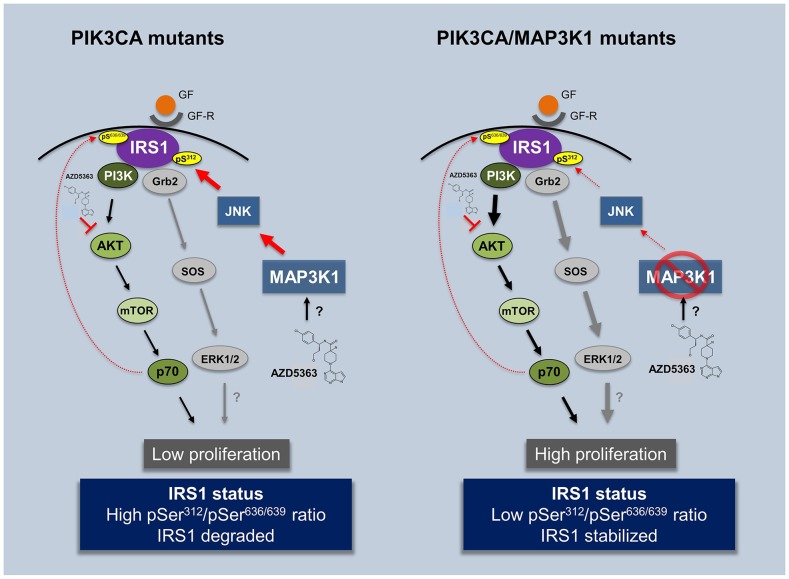
The PI3Kα signaling pathway is frequently hyper-activated in breast cancer (BrCa), as a result of mutations/amplifications in oncogenes (e.g. HER2), decreased function in tumor suppressors (e.g. PTEN) or activating mutations in key components of the pathway. In particular, activating mutations of PIK3CA (~45%) are frequently found in luminal A BrCa samples. Genomic studies have uncovered inactivating mutations in MAP3K1 (13-20%) and MAP2K4 (~8%), two upstream kinases of the JNK apoptotic pathway in luminal A BrCa samples. Further, simultaneous mutation of PIK3CA and MAP3K1 are found in ~11% of mutant PIK3CA tumors. How these two alterations may cooperate to elicit tumorigenesis and impact the sensitivity to PI3K and AKT inhibitors is currently unknown. Using CRISPR gene editing we have genetically disrupted MAP3K1 expression in mutant PIK3CA cell lines to specifically create in vitro models reflecting the mutational status of PIK3CA and MAP3K1 in BrCa patients. MAP3K1 deficient cell lines exhibited ~2.4-fold increased proliferation rate and decreased sensitivity to PI3Kα/δ(AZD8835) and AKT (AZD5363) inhibitors (~2.61 and ~5.23-fold IC50 increases, respectively) compared with parental control cell lines. In addition, mechanistic analysis revealed that MAP3K1 disruption enhances AKT phosphorylation and downstream signaling and reduces sensitivity to AZD5363-mediated pathway inhibition. This appears to be a consequence of deficient MAP3K1-JNK signaling increasing IRS1 stability and therefore promoting IRS1 binding to p85, resulting in enhanced PI3Kα activity. Using 3D-MCF10A-PI3KαH1047R models, we found that MAP3K1 depletion increased overall acinar volume and counteracted AZD5363-mediated reduction of acinar growth due to enhanced proliferation and reduced apoptosis. Furthermore, in vivo efficacy studies revealed that MAP3K1-deficient MCF7 tumors were less sensitive to AKT inhibitor treatment, compared with parental MCF7 tumors. Our study provides mechanistic and in vivo evidence indicating a role for MAP3K1 as a tumor suppressor gene at least in the context of PIK3CA-mutant backgrounds. Further, our work predicts that MAP3K1 mutational status may be considered as a predictive biomarker for efficacy in PI3K pathway inhibitor trials.

Keywords: CRISPR gene editing; MAP3K1; PIK3CA; breast cancer; luminal A.


Conflict of interest statement

CONFLICTS OF INTEREST All authors are current or former employees of AstraZeneca. K. Hudson and F Cruzalegui have ownership interest (including patents) and are AstraZeneca shareholders. No potential conflicts of interest were disclosed by the other authors.

Figures

Figure 1
Figure 1. MAP3K1 inhibition reduces sensitivity to upstream PI3K pathway inhibitors
(A) MCF7, T47D and MCF10A-PI3KαH1047R cells were cultured and transfected with MAP3K1 (siM3K1P) or control (scRNA) siRNAs for 48h. Cultures were treated with 250nM AZD8835 (+) or DMSO (−) as indicated 24h prior to cell lysis. Cell lysates were then immunoblotted with indicated antibodies (Abs). P-values were determined by the Student's t-test. (B) Lysates from MCF7 parental and MAP3K1-deficient (CR1.4 and CR2.5) cells were cultured and treated with 250 nM AZD8835 or 25 nM AZD5363 as indicated. Lysates were collected and processed for immunoblotting with the indicated Abs. (C) IncuCyte cell proliferation assays showing relative % of confluence of MCF7 parental versus MAP3K1-deficient (CR1.4 and CR2.5) cultures treated with DMSO (black), AZD8835 (red) and AZD5363 (green) for 66 hours. * Statistical significance of p < 0.05, determined by the Student's t-test.
Figure 2
Figure 2. MAP3K1 depletion correlates with increased IRS1 stability
(A) MCF7 parental, CR1.4 and CR2.5 cells were treated with 250 nM AZD8835, 250 nM AZD5363 or DMSO 24h prior to cell lysis. Cell lysates were collected and immunoblotted with indicated Abs. (B) MCF7 parental, CR1.4 and CR2.5 cells were incubated with 50μg/ml cycloheximide (CHX) at the indicated time points in the presence or absence of AZD5363 and immunoblotted with total- and phospho (Ser312)-IRS1 specific Abs. Densitometry quantification is shown in Supplementary Figure 2D. (C) Whole cell lysates were incubated with PI3K regulatory subunit (p85) Abs overnight. Immuno-complex pull-downs were performed using magnetic Protein A beads and immunoblotted with the indicated Abs. (D) Immunoblots from MCF7 parental and CR2.5 cells cultured in the presence (+) or absence (−) of AZD5363 and immunoblotted with the indicated Abs.
Figure 3
Figure 3. MAP3K1 depletion in 3D-MCF10A-PI3KαH1047R acini elicits apoptosis resistance and increased proliferation
(A) Representative bright field images from parental and MAP3K1-deficient MCF10A-PI3KαH1047R acini atday 15 of morphogenesis. Acini were treated from day 4 to day 15 with 10 μM AZD5363 as indicated. Right graph represents mean volume of acini which was calculated using SPOT software following the equation [(length × width2)/2 = acinus volume (mm3)] (N = 10). (B) Confocal equatorial images from parental and MAP3K1-deficient MCF10A-PI3KαH1047R treated from day 4 to day 15 with 10mM AZD5363. At day 15 of morphogenesis acini were fixed and immunostained using cleaved caspase 3 (c-c3) (upper panels) and pRb (lower panels) Abs. Quantification of events is represented on right graphs (N = 20). (C) In identical conditions as in (b) acini were stained using pS6 RP Abs. Right graph shows the mean intensity in arbitrary units (a.u) of pS6 RP signal calculated with ImageJ (N = 20). Scale bars indicate 25 μm. P-values were determined by the Student's t-test.
Figure 4
Figure 4. MAP3K1-deficient tumors are resistant to AZD5363 treatment
(A) Quantification of tumor volume following vehicle or AZD5363 treatment in MCF7 parental (upper left panel) versus MCF7 CR2.5 (upper right panel) xenograft after 18 days dosing. P-values were determined by the Student's t-test. (B and C) Representative immunostainings of phospho-S6 RP, phospho-IRS1 (B) and phospho-Rb (C) markers in MCF7 parental and MCF7 CR2.5 xenografts sections from xenograft tumors. Scale bars (yellow) represent 20 μm. Graphs show analysis and quantification of positive events using HALO (indica labs). The resulting algorithm was applied to the whole slide (n = 6) (see Supplementary Figure 4 for more details). P-values were determined by the Student's t-test.
Figure 5
Figure 5. Impact of AZD5363 treatment in PIK3CA and double mutant PIK3CA/MAP3K1 patients
Illustration contemplating experimental (in vitro, 3D organoids and in vivo) and clinical observations presented in the study. AZD5363 can be used as an efficient compound to treat mPIK3CA tumors by blocking the pathway at the level of AKT. However its efficiency may be compromised in patients harboring co-occurring MAP3K1 LoF mutation. Patients with reduced MAP3K1 expression have deregulated JNK pathway activity and consequently decreased phospho-serine IRS1 (S312) levels. This increases IRS1 stability and subsequently brings about the re-activation of PI3Kα. pS, phospho-serine, GF, growth factor, GF-R, growth factor receptor.

References

    1. Polyak K. Heterogeneity in breast cancer. J Clin Invest. 2011;121:3786–8. - PMC - PubMed
    1. Zardavas D, Irrthum A, Swanton C, Piccart M. Clinical management of breast cancer heterogeneity. Nat Rev Clin Oncol. 2015;12:381–94. - PubMed
    1. Cancer Genome Atlas N. Comprehensive molecular portraits of human breast tumours. Nature. 2012;490:61–70. - PMC - PubMed
    1. Ellis MJ, Ding L, Shen D, Luo J, Suman VJ, Wallis JW, Van Tine BA, Hoog J, Goiffon RJ, Goldstein TC, Ng S, Lin L, Crowder R, et al. Whole-genome analysis informs breast cancer response to aromatase inhibition. Nature. 2012;486:353–60. - PMC - PubMed
    1. Stephens PJ, Tarpey PS, Davies H, Van Loo P, Greenman C, Wedge DC, Nik-Zainal S, Martin S, Varela I, Bignell GR, Yates LR, Papaemmanuil E, Beare D, et al. The landscape of cancer genes and mutational processes in breast cancer. Nature. 2012;486:400–4. - PMC - PubMed