Intermolecular correlations are necessary to explain diffuse scattering from protein crystals
- PMID: 29765611
- PMCID: PMC5947726
- DOI: 10.1107/S2052252518001124
Intermolecular correlations are necessary to explain diffuse scattering from protein crystals
Abstract
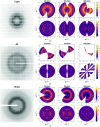
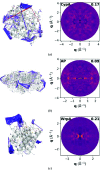
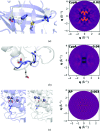
Conformational changes drive protein function, including catalysis, allostery and signaling. X-ray diffuse scattering from protein crystals has frequently been cited as a probe of these correlated motions, with significant potential to advance our understanding of biological dynamics. However, recent work has challenged this prevailing view, suggesting instead that diffuse scattering primarily originates from rigid-body motions and could therefore be applied to improve structure determination. To investigate the nature of the disorder giving rise to diffuse scattering, and thus the potential applications of this signal, a diverse repertoire of disorder models was assessed for its ability to reproduce the diffuse signal reconstructed from three protein crystals. This comparison revealed that multiple models of intramolecular conformational dynamics, including ensemble models inferred from the Bragg data, could not explain the signal. Models of rigid-body or short-range liquid-like motions, in which dynamics are confined to the biological unit, showed modest agreement with the diffuse maps, but were unable to reproduce experimental features indicative of long-range correlations. Extending a model of liquid-like motions to include disorder across neighboring proteins in the crystal significantly improved agreement with all three systems and highlighted the contribution of intermolecular correlations to the observed signal. These findings anticipate a need to account for intermolecular disorder in order to advance the interpretation of diffuse scattering to either extract biological motions or aid structural inference.
Keywords: diffuse scattering; intermolecular correlations.
Figures


Similar articles
-
Diffuse X-ray scattering from correlated motions in a protein crystal.Nat Commun. 2020 Mar 9;11(1):1271. doi: 10.1038/s41467-020-14933-6. Nat Commun. 2020. PMID: 32152274 Free PMC article.
-
Internal protein motions in molecular-dynamics simulations of Bragg and diffuse X-ray scattering.IUCrJ. 2018 Jan 25;5(Pt 2):172-181. doi: 10.1107/S2052252518000519. eCollection 2018 Mar 1. IUCrJ. 2018. PMID: 29765607 Free PMC article.
-
Rigid-body motion is the main source of diffuse scattering in protein crystallography.IUCrJ. 2019 Feb 16;6(Pt 2):277-289. doi: 10.1107/S2052252519000927. eCollection 2019 Mar 1. IUCrJ. 2019. PMID: 30867925 Free PMC article.
-
X-ray Scattering Studies of Protein Structural Dynamics.Chem Rev. 2017 Jun 28;117(12):7615-7672. doi: 10.1021/acs.chemrev.6b00790. Epub 2017 May 30. Chem Rev. 2017. PMID: 28558231 Free PMC article. Review.
-
Bringing diffuse X-ray scattering into focus.Curr Opin Struct Biol. 2018 Jun;50:109-116. doi: 10.1016/j.sbi.2018.01.009. Epub 2018 Feb 16. Curr Opin Struct Biol. 2018. PMID: 29455056 Free PMC article. Review.
Cited by
-
Diffuse X-ray scattering from correlated motions in a protein crystal.Nat Commun. 2020 Mar 9;11(1):1271. doi: 10.1038/s41467-020-14933-6. Nat Commun. 2020. PMID: 32152274 Free PMC article.
-
Robust total X-ray scattering workflow to study correlated motion of proteins in crystals.Nat Commun. 2023 Mar 3;14(1):1228. doi: 10.1038/s41467-023-36734-3. Nat Commun. 2023. PMID: 36869043 Free PMC article.
-
Reproducibility of protein x-ray diffuse scattering and potential utility for modeling atomic displacement parameters.Struct Dyn. 2021 Jul 8;8(4):044701. doi: 10.1063/4.0000087. eCollection 2021 Jul. Struct Dyn. 2021. PMID: 34258328 Free PMC article.
-
Scaling and merging macromolecular diffuse scattering with mdx2.Acta Crystallogr D Struct Biol. 2024 May 1;80(Pt 5):299-313. doi: 10.1107/S2059798324002705. Epub 2024 Apr 12. Acta Crystallogr D Struct Biol. 2024. PMID: 38606664 Free PMC article.
-
Liquid-like and rigid-body motions in molecular-dynamics simulations of a crystalline protein.Struct Dyn. 2019 Dec 18;6(6):064704. doi: 10.1063/1.5132692. eCollection 2019 Nov. Struct Dyn. 2019. PMID: 31867408 Free PMC article.
References
-
- Adams, P. D. et al. (2010). Acta Cryst. D66, 213–221.
-
- Ayyer, K. et al. (2016). Nature (London), 530, 202–206.
-
- Benoit, J.-P. & Doucet, J. (1995). Q. Rev. Biophys. 28, 131–169. - PubMed
Grants and funding
LinkOut - more resources
Full Text Sources
Other Literature Sources

