Comparative Study
. 2018 Apr 17;5(2):ENEURO.0070-18.2018.
doi: 10.1523/ENEURO.0070-18.2018. eCollection 2018 Mar-Apr.

Beneficial Outcome of Urethane Treatment Following Status Epilepticus in a Rat Organophosphorus Toxicity Model

Affiliations
Comparative Study

Beneficial Outcome of Urethane Treatment Following Status Epilepticus in a Rat Organophosphorus Toxicity Model

Asheebo Rojas et al. eNeuro. .

Abstract

The efficacy of benzodiazepines to terminate electrographic status epilepticus (SE) declines the longer a patient is in SE. Therefore, alternative methods for ensuring complete block of SE and refractory SE are necessary. We compared the ability of diazepam and a subanesthetic dose of urethane to terminate prolonged SE and mitigate subsequent pathologies. Adult Sprague Dawley rats were injected with diisopropylfluorophosphate (DFP) to induce SE. Rats were administered diazepam (10 mg/kg, ip) or urethane (0.8 g/kg, s.c.) 1 h after DFP-induced SE and compared to rats that experienced uninterrupted SE. Large-amplitude and high-frequency spikes induced by DFP administration were quenched for at least 46 h in rats administered urethane 1 h after SE onset as demonstrated by cortical electroencephalography (EEG). By contrast, diazepam interrupted SE but seizures with high power in the 20- to 70-Hz band returned 6-10 h later. Urethane was more effective than diazepam at reducing hippocampal neurodegeneration, brain inflammation, gliosis and weight loss as measured on day 4 after SE. Furthermore, rats administered urethane displayed a 73% reduction in the incidence of spontaneous recurrent seizures after four to eight weeks and a 90% reduction in frequency of seizures in epileptic rats. By contrast, behavioral changes in the light/dark box, open field and a novel object recognition task were not improved by urethane. These findings indicate that in typical rodent SE models, it is the return of SE overnight, and not the initially intense 1-2 h of SE experience, that is largely responsible for neurodegeneration, accompanying inflammation, and the subsequent development of epilepsy.

Keywords: DFP; EEG; diazepam; hippocampus; neurodegeneration; urethane.


Figures

None
Graphical abstract
Figure 1.
Figure 1.
Experimental paradigm of chemical administration in a rat model of DFP-induced SE. All rats were administered pyridostigmine bromide and atropine methylnitrate or ethylatropine bromide (Rojas et al., 2017) followed by DFP to induce SE. For the diazepam cohort, rats were injected with one dose of diazepam 1 h after DFP-induced SE onset. For urethane treatment following DFP, rats were injected with a single dose of urethane 60 or 120 min from the onset of SE. A separate cohort of rats was not administered any drugs after SE onset (uninterrupted SE). All rats were allowed to recover and were monitored for 4 d.
Figure 2.
Figure 2.
Urethane, but not diazepam, suppresses the return of seizure activity following 1 h of DFP-induced SE. A1, Cortical EEG activity was recorded prior and during SE induced by exposure to DFP for 24 h. A representative EEG trace and sonogram from the cortical recording of an adult male rat showing increased spike activity just after exposure to DFP that develops into SE (denoted by the bar above the trace). Spike activity was quieted by administration of diazepam (10 mg/kg, i.p.) 1 h after SE onset (red triangle) but returned within a few hours as denoted by the ictal activity return phase. A2, is a similar EEG trace from the cortical recording of a second adult male rat that received diazepam 1 h after SE onset. B1, A representative EEG trace from the cortical recording of an adult male rat shows increased spike activity just after exposure to DFP that developed into SE (denoted by the bar above the trace), which was quieted following brief exposure to isoflurane (inhaled) and subsequent injection of urethane (0.8 g/kg, s.c., red triangle) 1 h after SE onset. B2, Similar EEG trace from the cortical recording of a second adult male rat that received isoflurane and subsequent injection of urethane 1 h after SE onset. Below each raw EEG trace is a sonogram of the spike activity obtained in Spike2. The colors of the sonogram indicate the spectral power density in decibels (dB) at the indicated frequency. C, the EEG power in the 20- to 70-Hz bandwidth averaged over 300-s epochs during the 24-h period for six diazepam-treated and six urethane-treated rats. The dashed line indicates baseline power before DFP. D, During the first 5 h after DFP administration, no difference was detected between the two treatment groups (n = 6 for both diazepam and urethane) in the EEG power in the 20- to 70-Hz bandwidth. Error bars show SEM; p > 0.05, Student’s t test. E, A difference was detected between the two treatment groups [diazepam (n = 6) and urethane (n = 6)] in the EEG power in the 20- to 70-Hz bandwidth using power analysis during the period 10–24 h after SE. Error bars show SEM; p = 0.004, Student’s t test. The symbols in D, E represent each individual rat within the group.
Figure 3.
Figure 3.
Administration of urethane 2 h after DFP-induced SE onset terminated SE and suppressed the return of seizure activity. A, Cortical EEG activity was recorded prior and during SE induced by exposure to DFP for 24 h. A representative EEG trace from the cortical recording of an adult male rat showing increased spike activity just after exposure to DFP that developed into SE (denoted by the bar above the trace). Spike activity was quieted by brief exposure to isoflurane (gas, inhaled) and subsequent injection of urethane (0.8 g/kg, s.c.) 2 h after SE onset but returned within a few hours as denoted by the ictal activity return phase. B, Sonogram of the spike activity obtained in Spike2 for the 20- to 70-Hz bandwidth. C, Diagram showing the total EEG power in the 20- to 70-Hz bandwidth using power analysis during the first 24 h and the next day (D). The dashed line indicates no spiking activity.
Figure 4.
Figure 4.
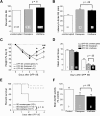
DFP-induced SE characteristics. A, Percentage of rats entering SE following a single intraperitoneal injection of DFP was not different between the groups (uninterrupted SE, diazepam-treated rats and urethane-treated rats; p = 0.6, Fisher’s exact test) of rats administered diazepam compared to urethane-injected rats 1 h after SE. B, Latency to the onset of SE following a single intraperitoneal injection of DFP in different groups of rats. (p > 0.05, one-way ANOVA with post hoc Bonferroni). The number inside the bar represents the number of rats from each group. C, Single injection of urethane (n = 16 rats) 60 min after SE onset significantly accelerated weight regain compared to 11 rats treated with diazepam (p < 0.05 day 3 and p < 0.01 day 4 by two-way ANOVA with post hoc Bonferroni). Rats administered DFP that did not receive anything after SE (n = 7) minimally began gaining weight on day 4. The dashed line indicated the original weight of the rats before any manipulation on day 0. D, There was no difference in the mean Irwin score measured 24 and 4 d after SE of 11 rats administered diazepam following DFP (gray bars) compared to 16 rats administered urethane (black bars; p > 0.05, one-way ANOVA with post hoc Bonferroni). In the diazepam group (gray bars), we killed three rats without obtaining the day 4 Irwin score (simply forgot to score them) and this attributed to the difference in the number of rats on day 1 compared to day 4. E, Survival rates of 11 rats that received diazepam, urethane (n = 16 rats), or nothing (n = 7 rats) up to day 4 after DFP-induced SE. No difference was detected in the survival rate for rats administered diazepam (11 of 13 rats survived) compared to urethane (16 of 17 rats survived) on days 1–4 after DFP-induced SE (p = 0.6, Fisher’s exact test). F, Inhibition of acetylcholinesterase in rat forebrain on day 4 after DFP exposure; p > 0.05, one-way ANOVA with post hoc Bonferroni. The number inside the bar represent the number of rats in each group. The controls were non-seizure rats that were administered pyridostigmine bromide, methylatropine nitrate, and water instead of DFP. Shown in B, D, F are the mean ± SEM.
Figure 5.
Figure 5.
Hippocampal neuroprotection by urethane following DFP-induced SE. Representative images of FJB staining in hippocampal sections (40 µm) in the hilus, CA1 and CA3 regions 4 d after DFP-induced SE for rats that experienced uninterrupted SE (A), rats treated with diazepam after 1 h of SE (B), and rats injected with urethane after 1 h of SE (C). Each panel contains representative images of hippocampal sections taken from rats administered DFP that did not experience SE (DFP no SE). Images were taken with a 5× objective lens for the one and two series and a 20× objective lens for three. The images are representative of four dorsal hippocampal sections per rat. Scale bar = 300 μm for series 1 and 2, and 75 μm for series 3. D, the average number of injured neurons per section 4 d after DFP-induced SE in three hippocampal regions (hilus, CA1, and CA3) of rats that experienced uninterrupted SE (white bar, open squares, n = 7 rats), rats treated with diazepam following 1 h of SE (gray bar, open circles, n = 9 rats), rats injected with urethane after 1 h of SE (black bar, open triangles, n = 15 rats), and rats injected with urethane after 2 h of SE (slashed bar, open diamonds, n = 8 rats; ***p < 0.001 in CA1 and CA3, the Mann–Whitney test was used to compare urethane to diazepam for rats that experienced 1 h of SE); ns = p > 0.05 by one-way ANOVA with post hoc Bonferroni. Data are the mean ± SEM. The symbols represent each individual rat within the group. The percentage of rats with 11 or more FluoroJade positive cells in the CA1 (E) and CA3 (F) regions of the hippocampus is shown for each treatment group (statistical significance is determined by p < 0.05, Fisher’s exact test comparing diazepam to urethane). The number of rats in each group is shown within the bars.
Figure 6.
Figure 6.
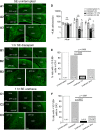
Induction of brain inflammatory mediators 4 d after DFP-induced SE in rats is attenuated by urethane. Fluorescence images (A) taken from the CA1 (top) and CA3 (bottom) regions in the hippocampus reveals basal expression of neuronal COX-2 in rats that did not experience SE (DFP-No SE). COX-2 expression is induced to the same degree in rats that experienced uninterrupted SE and rats administered diazepam 1 h following SE onset. Rats administered urethane 1 h following DFP-induced SE onset display lower induction of COX-2 in the CA1 and CA3 regions compared to diazepam. The images shown are a single representative of five hippocampal sections each from three rats in the groups. Scale bar = 100 μm. B, Change in abundance of 11 inflammatory mediator mRNAs from the forebrain of rats 4 d after injection with water or DFP to induce SE. Following DFP-induced SE, the mRNA fold change for all 11 mediators as a group was significantly reduced by urethane compared to diazepam (p = 0.01, paired t test). Data are the mean ± SEM. C, Changes in CCL2 protein in the brains of rats following DFP exposure measured 4 d after DFP-induced SE by ELISA. Data are the mean ± SEM. The symbols represent each individual rat within the group (n = 4–5 rats for each group; p < 0.001, one-way ANOVA with post hoc Bonferroni).
Figure 7.
Figure 7.
DFP-induced astrogliosis is reduced by urethane. Representative images (taken with a 10× objective lens) showing positive GFAP immunostaining (A) as an astrocyte marker and Iba1 immunofluorescence staining (B) as a microglial marker in the hippocampal CA3 region (DAB with a Nissl counterstain). Four days after DFP-induced SE, astrogliosis, and microgliosis were obvious in the sections obtained from rats as defined by the increased number of positively labeled cells in rats that experienced uninterrupted SE and rats administered diazepam 1 h after SE onset but not as much in sections taken from rats injected with urethane 1 h following SE onset or non-seizure controls. Scale bar, 100 μm. C, Induction of GFAP, CD11B and Iba1 mRNA in the forebrain 4 d following DFP SE in rats that experienced uninterrupted SE (n = 7), rats administered diazepam 1 h after SE onset-treated (n = 9 rats) and urethane-treated (1 h SE) rats (n = 13 rats; ***p < 0.001, one-way ANOVA with post hoc Bonferroni).
Figure 8.
Figure 8.
Urethane and diazepam have similar effects on exploration and anxiety behavior four to five weeks following SE. A, Schematic of light/dark exploration apparatus. Latency to enter the light compartment (B), number of entries into the light compartment (C), and the time spent in the light compartment (D) are shown for the three groups of rats (controls, DFP-SE followed by diazepam, DFP-SE followed by urethane). The bars show the mean of the group and the number in the white box within the bar represents the total number of rats in each group. The error bars represent SEM; p < 0.01 and p < 0.001, Kruskal–Wallis test with Dunn’s post hoc; ns = p > 0.05 by Kruskal–Wallis test with Dunn’s post hoc. Grubb’s test did not identify any outliers.
Figure 9.
Figure 9.
NOR memory in rats that experienced SE is unaffected by urethane. A, Schematic of NOR testing consisting of three epochs conducted over 2 d. B, Time spent in the center during the habituation is shown for the three groups tested; p < 0.01, by Kruskal–Wallis test with post hoc Dunn’s. C, A DI was used as a measure of memory retention. The number in the white box within the bar represents the total number of rats in each group; ns = p > 0.05, one-way ANOVA with Bonferroni post hoc. Rats that spent <30% of the exploration time with either identical object did not familiarize during the training session and were deemed not fit to perform NOR testing. These rats were not included in the analysis of the DI reducing the total number of rats to that shown within the bars for each group.
Figure 10.
Figure 10.
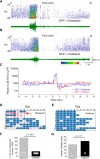
Urethane reduces the frequency of spontaneous recurrent seizures six to eight weeks following 1 h of DFP-induced SE. A, Cortical EEG activity was recorded four to six weeks after SE induction by exposure to DFP. A representative 10-min EEG trace in green from the cortical recording of an adult rat that received diazepam 1 h after SE showed spontaneous rapid increased spike activity that lasted ∼40 s with a fast termination followed by a post-ictal depression. B, A similar EEG trace in green from the cortical recording of a second adult male rat that received urethane 1 h after SE onset showing a similar seizure. Above each raw EEG trace in A, B is a sonogram of the spike activity in the 20- to 70-Hz bandwidth obtained in Spike2. The colors of the sonogram indicate the spectral power density in decibels (dB, inset) at the indicated frequency. C, Diagram showing the total EEG power in the 20- to 70-Hz bandwidth during the 10-min period that includes the SRS in A, B using power analysis software written in Python. The dashed line indicates no spiking activity (baseline). Note that immediately after the spiking stops the baseline of both traces becomes quiet for ∼2 min representing the post-ictal depression. D, E, Heat maps showing the number of seizures detected per day from each rat. F, A difference was detected between the two treatment groups [diazepam (n = 10) and urethane (n = 11)] in the percentage of rats that experienced at least one SRS during the 6–12 d of EEG recording; p = 0.001, Fisher’s exact test. G, A difference was also detected between the average seizure duration for the two treatment groups [diazepam (n = 10) and urethane (n = 11)]. Error bars show SEM; p = 0.01, Student’s t test. The total number of seizures is shown within the bars for each group.
Figure 11.
Figure 11.
A single subanesthetic dose of urethane does not produce lung tumors in rats. Representative photographs (A) of individual perfused lung lobes obtained from naïve control rats. A single lobe from three of eight rats is shown (scale bar, 0.7 cm) and (B) of individual perfused rat lung lobes seven months following a single dose of urethane (0.8 g/kg, s.c.). A single lobe from three of five treated rats is shown. None of the lobes displays evidence of lung adenomas as the surfaces were smooth and void of any cancerous outgrowths similar to the lobes of the naïve controls. Scale bar = 0.7 cm.

Similar articles

Cited by

References

    1. Apland JP, Aroniadou-Anderjaska V, Figueiredo TH, Rossetti F, Miller SL, Braga MF (2014) The limitations of diazepam as a treatment for nerve agent-induced seizures and neuropathology in rats: comparison with UBP302. J Pharmacol Exp Ther. 351:359–372. 10.1124/jpet.114.217299 - DOI - PMC - PubMed
    1. Bar-Klein G, Klee R, Brandt C, Bankstahl M ,Bascuñana P ,Töllner K ,Dalipaj H ,Bankstahl JP ,Friedman A ,Löscher W (2016) Isoflurane prevents acquired epilepsy in rat models of temporal lobe epilepsy. Ann f Neurol 80:896–908. 10.1002/ana.24804 - DOI - PubMed
    1. Bevins RA, Besheer J (2006) Object recognition in rats and mice: a one-trial non-matching-to-sample learning task to study ‘recognition memory.’ Nat Protoc 1:1306–1311. 10.1038/nprot.2006.205 - DOI - PubMed
    1. Borges K, Gearing M, McDermott DL, Smith AB, Almonte AG, Wainer BH, Dingledine R (2003) Neuronal and glial pathological changes during epileptogenesis in the mouse pilocarpine model. Exp Neurol 182:21–34. - PubMed
    1. Brandt C, Töllner K, Klee R, Bröer S, Löscher W (2015) Effective termination of status epilepticus by rational polypharmacy in the lithium-pilocarpine model in rats: window of opportunity to prevent epilepsy and prediction of epilepsy by biomarkers. Neurobiol Dis 75:78–90. 10.1016/j.nbd.2014.12.015 - DOI - PubMed

Publication types

MeSH terms

LinkOut - more resources