. 2018 Aug 1;164(2):563-575.
doi: 10.1093/toxsci/kfy113.

Reliability of In Vitro Methods Used to Measure Intrinsic Clearance of Hydrophobic Organic Chemicals by Rainbow Trout: Results of an International Ring Trial

Affiliations

Reliability of In Vitro Methods Used to Measure Intrinsic Clearance of Hydrophobic Organic Chemicals by Rainbow Trout: Results of an International Ring Trial

John Nichols et al. Toxicol Sci. .

Abstract

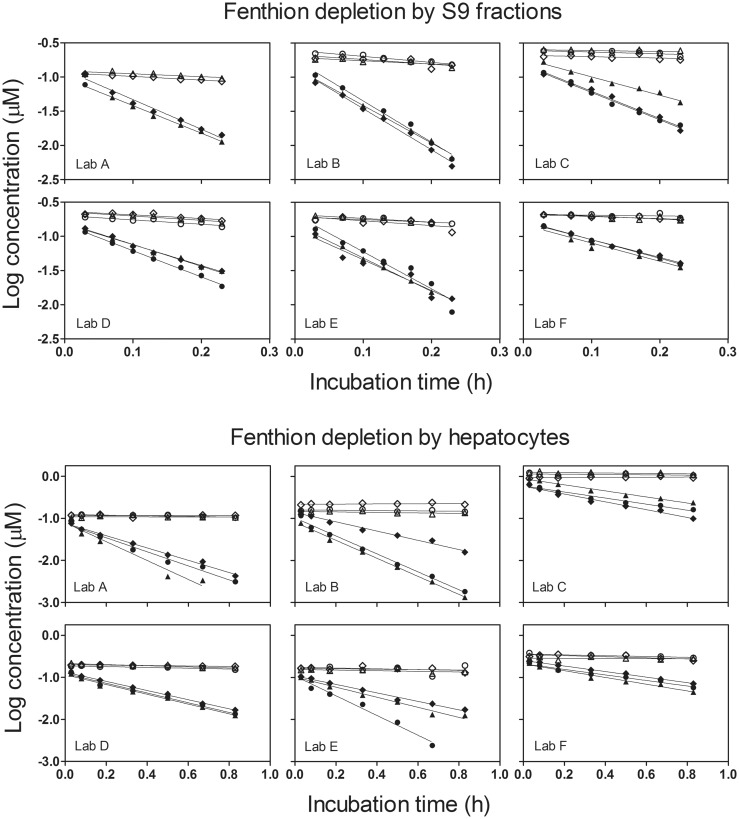
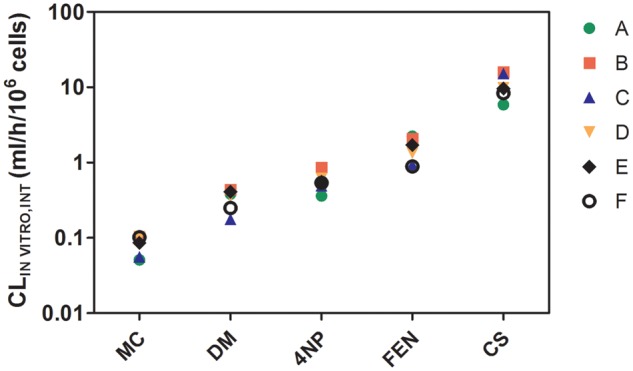
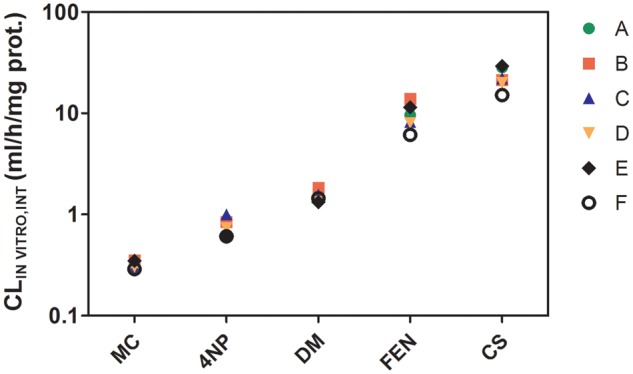
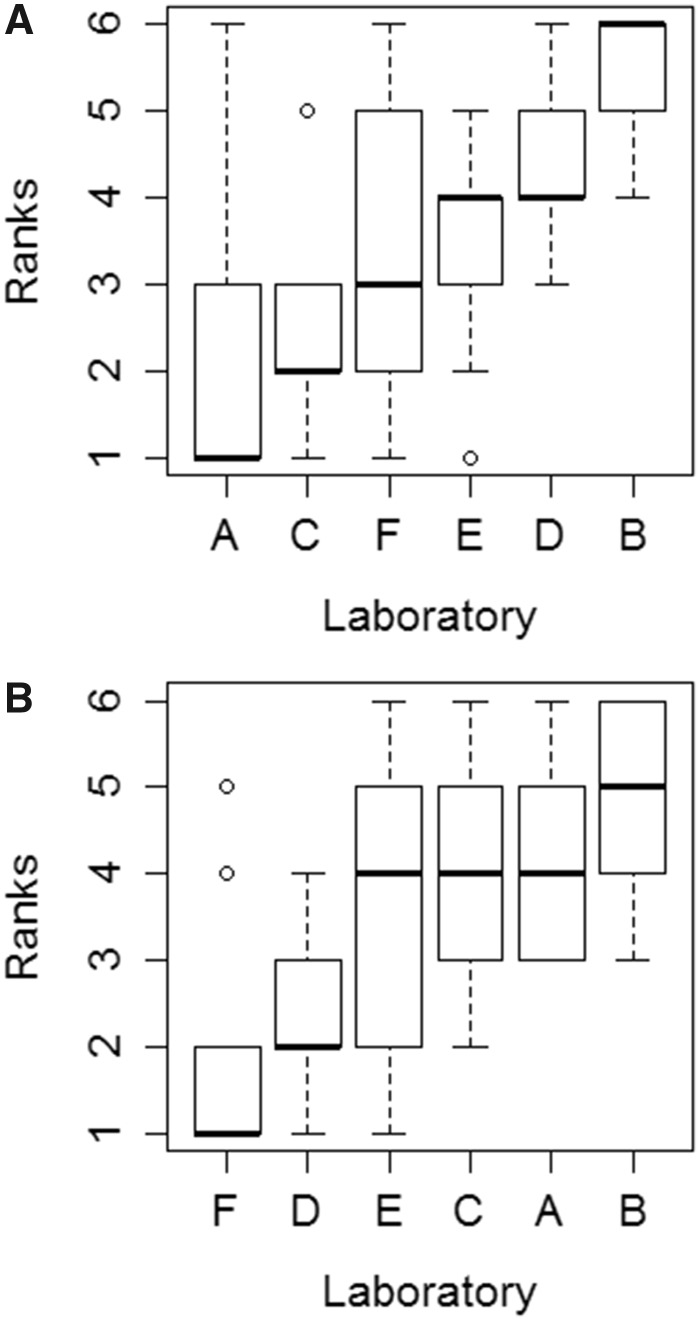
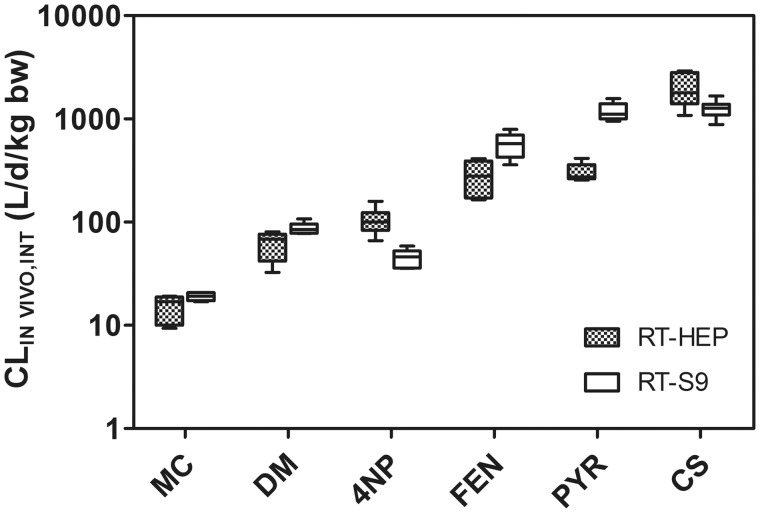
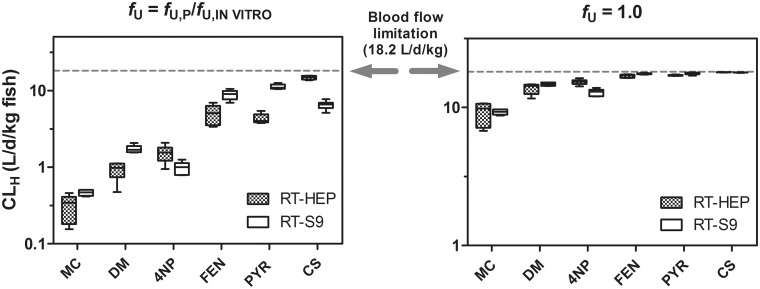
In vitro assays are widely employed to obtain intrinsic clearance estimates used in toxicokinetic modeling efforts. However, the reliability of these methods is seldom reported. Here we describe the results of an international ring trial designed to evaluate two in vitro assays used to measure intrinsic clearance in rainbow trout. An important application of these assays is to predict the effect of biotransformation on chemical bioaccumulation. Six laboratories performed substrate depletion experiments with cyclohexyl salicylate, fenthion, 4-n-nonylphenol, deltamethrin, methoxychlor, and pyrene using cryopreserved hepatocytes and liver S9 fractions from trout. Variability within and among laboratories was characterized as the percent coefficient of variation (CV) in measured in vitro intrinsic clearance rates (CLIN VITRO, INT; ml/h/mg protein or 106 cells) for each chemical and test system. Mean intralaboratory CVs for each test chemical averaged 18.9% for hepatocytes and 14.1% for S9 fractions, whereas interlaboratory CVs (all chemicals and all tests) averaged 30.1% for hepatocytes and 22.4% for S9 fractions. When CLIN VITRO, INT values were extrapolated to in vivo intrinsic clearance estimates (CLIN VIVO, INT; l/d/kg fish), both assays yielded similar levels of activity (<4-fold difference for all chemicals). Hepatic clearance rates (CLH; l/d/kg fish) calculated using data from both assays exhibited even better agreement. These findings show that both assays are highly reliable and suggest that either may be used to inform chemical bioaccumulation assessments for fish. This study highlights several issues related to the demonstration of assay reliability and may provide a template for evaluating other in vitro biotransformation assays.


Figures

Figure 1.
Figure 1.
In vitro biotransformation of fenthion (FEN) by rainbow trout liver S9 fractions (RT-S9) and cryopreserved rainbow trout hepatocytes (RT-HEP). Each panel shows data from one laboratory. Different symbol shapes represent measured concentrations from 3 independent experiments performed on different days. Filled symbols represent data derived from active biological material, whereas open symbols represent data from enzymatically inactive controls. Depletion curves shown for the RT-HEP assays do not take into account small differences in cell concentration between runs (typically ± 25% of nominal). Lines shown in each panel represent linear regression equations fitted to the data from independent runs.
Figure 2.
Figure 2.
In vitro intrinsic clearance rates (CLIN VITRO, INT) for methoxychlor (MC), deltamethrin (DM), 4-nonylphenol (4NP), fenthion(FEN), and cyclohexyl salicylate (CS), determined using cryopreserved rainbow trout hepatocytes (RT-HEP). The symbols represent intrinsic clearance rates measured by 6 different laboratories (A–F). Each symbol represents the mean of 3 independently determined values. Variances associated with each of these means are given in Supplementary Table S5.
Figure 3.
Figure 3.
In vitro intrinsic clearance rates (CLIN VITRO, INT) for MC, 4NP, DM, FEN, and CS, determined using rainbow trout liver S9 fractions (RT-S9). The symbols represent intrinsic clearance rates measured by 6 different laboratories (A–F). Each symbol represents the mean of 3 independently determined values. Variances associated with each of these means are given in Supplementary Table S6.
Figure 4.
Figure 4.
Evaluation of potential laboratory bias in measured in vitro intrinsic clearance rates (CLIN VITRO, INT). Individual laboratories are identified as A–F. The median rank associated with each laboratory is shown as a horizontal thick line, and the top and bottom of each box represents the 75th and 25th percentiles, respectively. The top and bottom whiskers extend up to 1.5 times the interquartile range, whereas dots represent individual observations beyond this range. Calculated ranks are based on measured rates of activity for CS, FEN, 4NP, DM, and MC (one value for each laboratory). Additional ranks were calculated using data for pyrene (PYR; 4 independent determinations per laboratory), run as a reference chemical (n = 9 total ranks). A, Ranks determined for each laboratory based on data collected using cryopreserved rainbow trout hepatocytes (RT-HEP). B, Ranks determined for each laboratory based data collected using rainbow trout liver S9 fractions (RT-S9).
Figure 5.
Figure 5.
Rank-rank plots showing the relationship between intrinsic clearance values for individual test chemicals and for PYR, where PYR was run alongside the same test chemical. Each observation represents a pair of ranks for one laboratory. The frequency of any given observation (1–3 out of a possible 4) is denoted by the size of the dot. A, Ranks based on data collected using cryopreserved rainbow trout hepatocytes (RT-HEP). B, Ranks based on data collected using rainbow trout liver S9 fractions (RT-S9).
Figure 6.
Figure 6.
Estimated in vivo intrinsic clearance rates (CLIN VIVO, INT) for MC, DM, 4NP, FEN, PYR, and CS. CLIN VIVO, INT values were calculated from measured rates of in vitro intrinsic clearance obtained using cryopreserved rainbow trout hepatocytes (RT-HEP) or trout liver S9 fractions (RT-S9). Means calculated for all laboratories are shown as horizontal lines. Values shown for MC, DM, 4NP, FEN, and CS represent data generated using chemical-specific lots of biological material, whereas those given for PYR represent studies performed using all 5 lots of tested material. Boxes denote the 25th and 75th percentiles, whereas top and bottom whiskers extend up to 1.5 times the interquartile range.
Figure 7.
Figure 7.
Estimated hepatic clearance values (CLH) for MC, DM, 4NP, FEN, PYR, and CS. CLH values were calculated using a well-stirred liver model under two different binding assumptions (fU = fU, P/fU, HEP or S9 or fU = 1.0; see text for details). In vitro intrinsic clearance rates used as inputs to these calculations were generated using cryopreserved rainbow trout hepatocytes (RT-HEP) or rainbow trout liver S9 fractions (RT-S9). Means calculated for all laboratories are shown as horizontal lines. Values shown for MC, DM, 4NP, FEN, and CS represent data generated using chemical-specific lots of biological material (RT-HEP or RT-S9), whereas those given for PYR represent studies performed using all 5 lots of tested material. Boxes denote the 25th and 75th percentiles, whereas top and bottom whiskers extend up to 1.5 times the interquartile range.

References

    1. Arnot J. A., Gobas F. A. P. C. (2003). A generic QSAR for assessing the bioaccumulation potential of organic chemicals in aquatic food webs. QSAR Comb. Sci. 22, 337–345.
    1. Arnot J. A., Gobas F. A. P. C. (2004). A food web bioaccumulation model for organic chemicals in aquatic ecosystems. Environ. Toxicol. Chem. 23, 2343–2355. - PubMed
    1. Bischof I., Koster J., Segner H., Schlechtriem C. (2016). Hepatocytes as in vitro test system to investigate metabolite patterns of pesticides in farmed rainbow trout and common carp: Comparison between in vivo and in vitro and across species. Comp. Biochem. Physiol. 187, 62–73. - PubMed
    1. Brinkman M., Schlechtriem C., Reininghaus M., Eichbaum K., Buchinger S., Reifferscheid G., Hollert H., Preuss T. G. (2016). Cross-species extrapolation of uptake and disposition of neutral organic chemicals in fish using a multispecies physiologically-based toxicokinetic model framework. Environ. Sci. Technol. 50, 1914–1923. - PubMed
    1. Chen Y., Hermens J. L. M., Jonker M. T. O., Arnot J. A., Armitage J. M., Brown T., Nichols J. W., Fay K. A., Droge S. T. J. (2016). Which molecular features affect the intrinsic hepatic clearance rate of ionizable chemicals in fish? Environ. Sci. Technol. 50, 12722–12731. - PubMed

Publication types

MeSH terms

Substances