

Case Reports
doi: 10.1056/NEJMc1511490.
Trametinib in Histiocytic Sarcoma with an Activating MAP2K1 (MEK1) Mutation
Affiliations
- PMID: 29768143
- PMCID: PMC6062005
- DOI: 10.1056/NEJMc1511490
Item in Clipboard
Case Reports
Trametinib in Histiocytic Sarcoma with an Activating MAP2K1 (MEK1) Mutation
N Engl J Med.
.
No abstract available
Figures
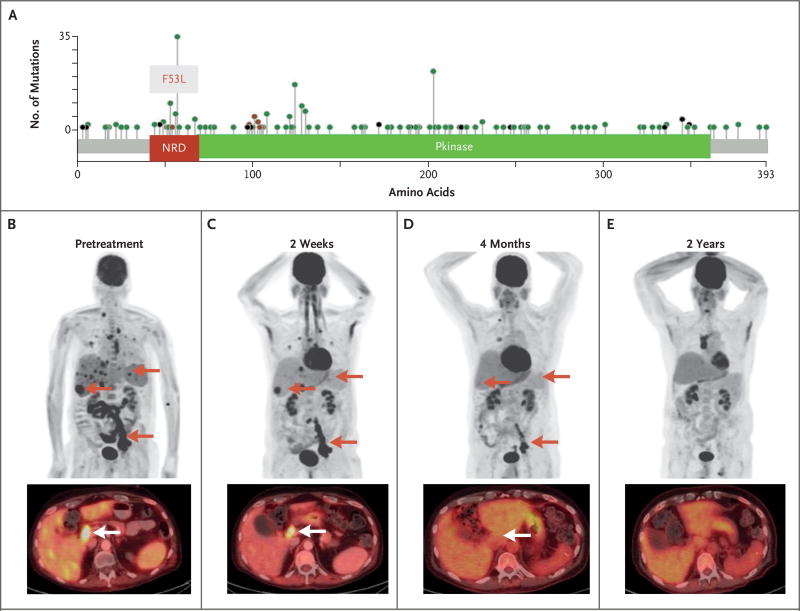
The MAP2K1 (MEK1) protein structure as well as mutations seen in the negative regulatory domain (NRD) and the protein kinase domain (Pkinase) are shown (Panel A). Locations of mutations and domains in proteins are shown by lollipop structures, with the mutation type indicated by color. Protein domains are also distinguished by color. Red denotes in-frame, black truncating, and green missense mutations. Maximum intensity projection (MIP) coronal and axial fused images from combined positron-emission tomography and computed tomography (PET–CT) with 18F-fluorodeoxyglucose (FDG) before treatment show splenomegaly and widespread hypermetabolic lesions (red and white arrows) in the liver (maximum standardized uptake value [SUV], 9.8), spleen, lungs, and pelvic nodes (Panel B). Images obtained 2 weeks after the initiation of trametinib show interval resolution of splenomegaly and a decrease in the number, size, and metabolism of lesions in the liver (maximum SUV, 5.9), spleen, lungs, and pelvic nodes (Panel C). Images obtained 4 months after treatment show further response to treatment, with resolution of multiple lesions and a decrease in the size and 18F-FDG avidity of the residual sites of disease. A lesion in the liver had a maximum SUV of 3.4 (Panel D). Coronal MIP and an axial PET–CT fused image after 2 years of treatment show a complete response to treatment, with no evidence of FDG neoplastic disease (Panel E); the foci of intense FDG activity uptake in the mediastinum correspond with biopsy-proven aspergillus infection, and the foci of intense FDG activity uptake in the left groin correspond to benign inflammation. Images courtesy of Dr. Lorenzo Mannelli, Department of Radiology, Memorial Sloan Kettering Cancer Center.
References
Publication types
MeSH terms
Substances
Grants and funding
LinkOut - more resources
Full Text Sources
Other Literature Sources
Miscellaneous