. 2018 May 15;48(5):1006-1013.e6.
doi: 10.1016/j.immuni.2018.04.020.

Tissue Damage Signaling Is a Prerequisite for Protective Neutrophil Recruitment to Microbial Infection in Zebrafish

Affiliations

Tissue Damage Signaling Is a Prerequisite for Protective Neutrophil Recruitment to Microbial Infection in Zebrafish

Cong Huang et al. Immunity. .

Abstract

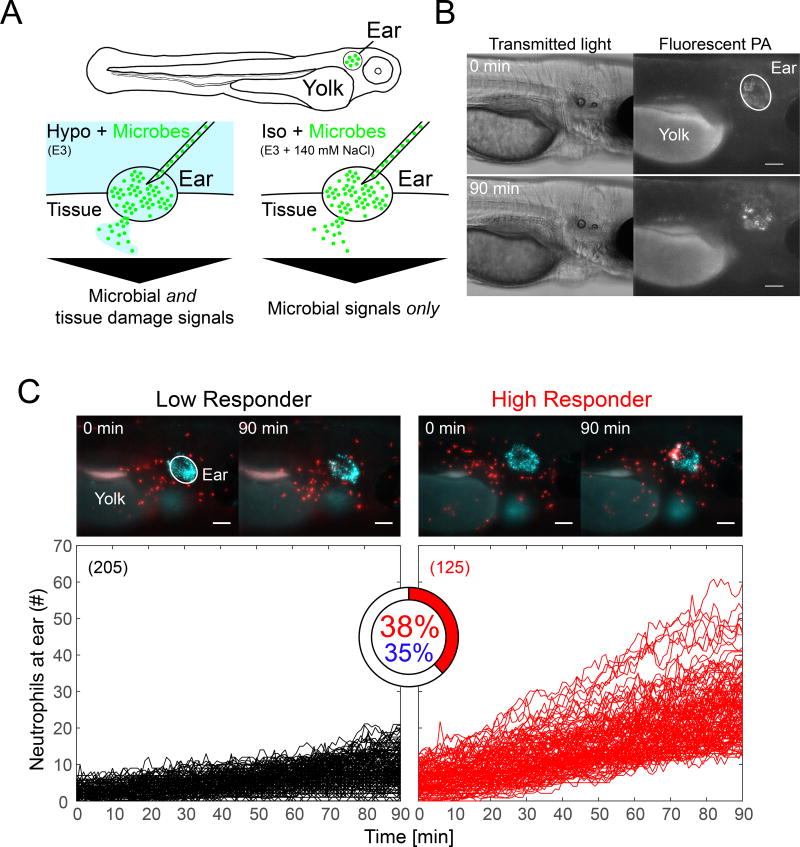
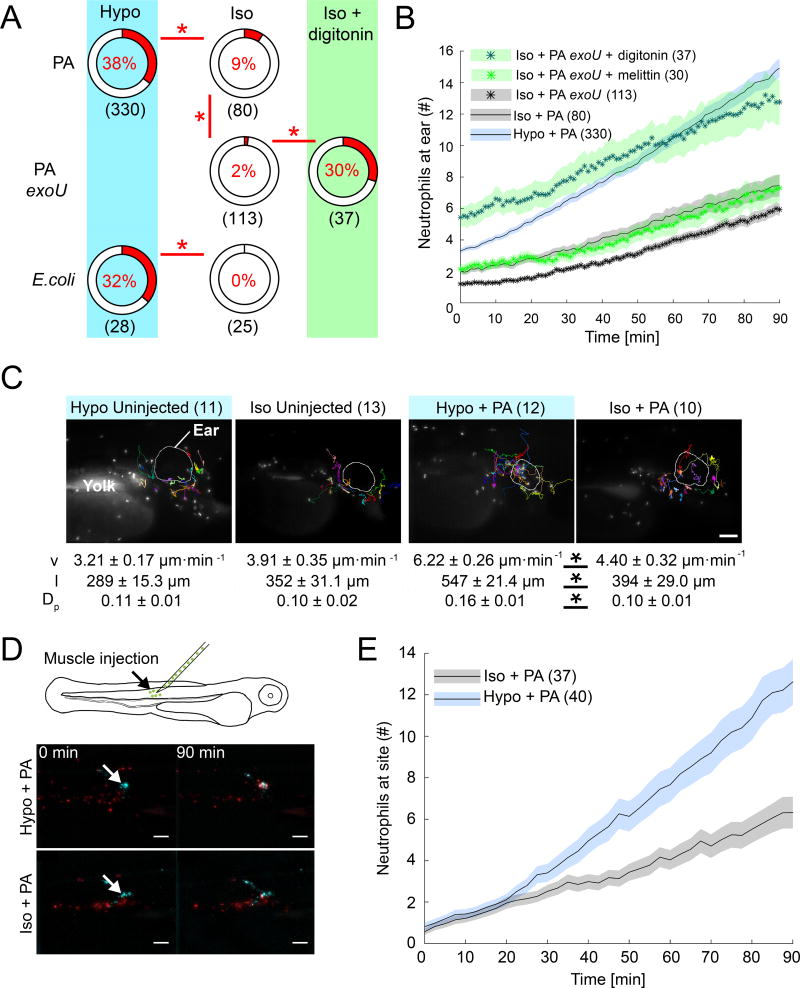
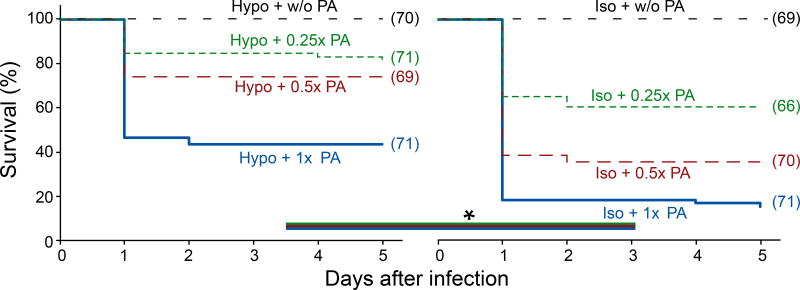
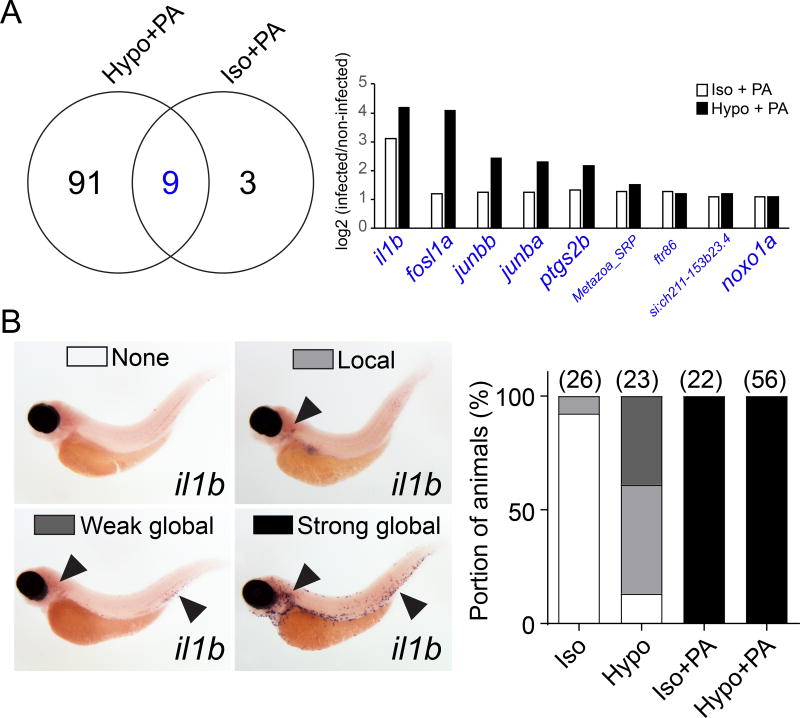
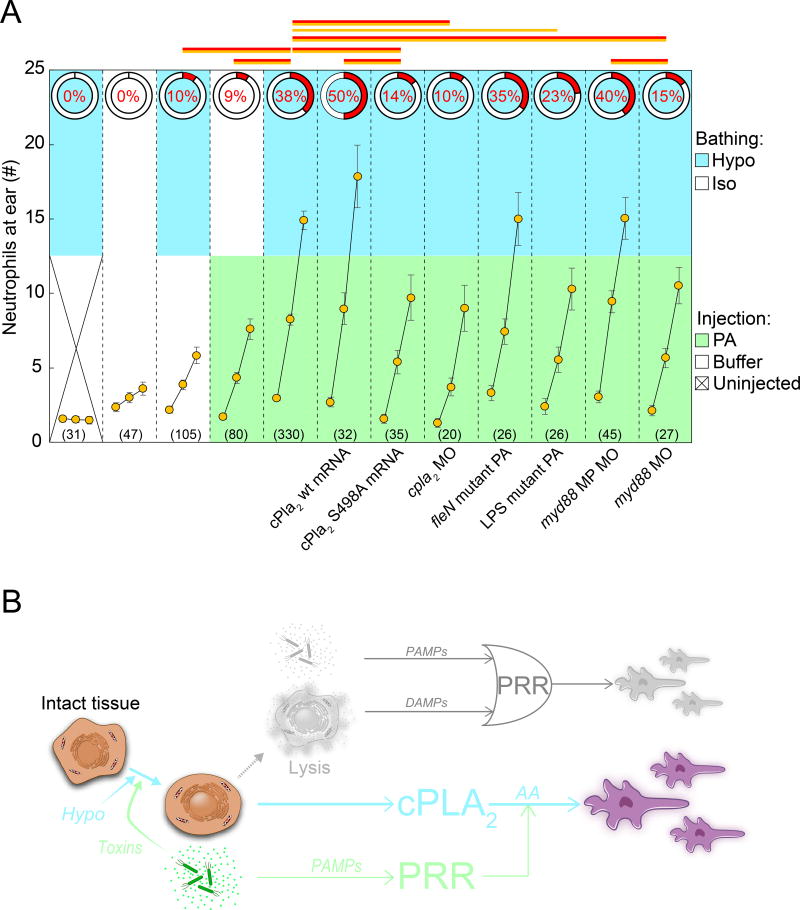
Tissue damage and infection are deemed likewise triggers of innate immune responses. But whereas neutrophil responses to microbes are generally protective, neutrophil recruitment into damaged tissues without infection is deleterious. Why neutrophils respond to tissue damage and not just to microbes is unknown. Is it a flaw of the innate immune system that persists because evolution did not select against it, or does it provide a selective advantage? Here we dissect the contribution of tissue damage signaling to antimicrobial immune responses in a live vertebrate. By intravital imaging of zebrafish larvae, a powerful model for innate immunity, we show that prevention of tissue damage signaling upon microbial ear infection abrogates leukocyte chemotaxis and reduces animal survival, at least in part, through suppression of cytosolic phospholipase A2 (cPla2), which integrates tissue damage- and microbe-derived cues. Thus, microbial cues are insufficient, and damage signaling is essential for antimicrobial neutrophil responses in zebrafish.


Conflict of interest statement

Declaration of Interests

The authors declare no competing interests.

Figures

Figure 1
Figure 1. Ear infection of zebrafish larvae with Pseudomonas aeruginosa (PA) triggers strong neutrophil responses in a subset of animals
(A) Cartoon scheme of experiment. (B) Ear injection of microbes generates a localized source of infection as visualized with EGFP-tagged PA (shown: hypotonic bathing conditions). Panel represents n=6 injection experiments. (C) Upper panel, time-lapse montage of neutrophil recruitment to infected ears in a Low Responder (left) and a High Responder (right) animal at indicated times. Panels represent n=205 (left) and n=125 (right) injection experiments, respectively. Neutrophils are in red. Fluorescent beads (blue) mark the ear region. Scale bar, 100 µm. Lower panel, neutrophil recruitment kinetics in Hypo + PA fish computationally classified into low (black) and high (red) responders by comparison to user-generated training sets. High responder index is depicted as pie chart. Blue percentage, an unsupervised (that is, no user-defined training sets) Gaussian distribution clustering algorithm determines a similar HR-index. Parentheses, number of injection experiments. Please see also Figure S1.
Figure 2
Figure 2. Selective suppression of tissue damage signaling abrogates neutrophil responses to infection sites
(A) HR indices after PA or E. coli infection in the presence (Hypo) or absence (Iso) of osmotic tissue damage signaling, and as a function of microbial cytotoxicity (ExoU). HR indices are depicted as pie charts. Asterisks, Fisher’s exact test p<0.05. Note, the Hypo + PA reference set is the same as in the other figures. Parentheses, number of injection experiments (B) Average neutrophil recruitment as a function of endogenous, microbial (ExoU) and exogenous (digitonin, melittin) cytotoxicity. Shaded area, SEM of n injection experiments (parentheses). (C) Neutrophil tracking analysis. Top panel, images representative of n (parentheses) injection experiments. Lower panel, table of leukocyte migration parameters. v, migration velocity. l, path length. Dp, directional persistence. Shown are average values ± SEM for indicated number of injection experiments (parentheses). Asterisks, one-way Anova between indicated groups p<0.05. Scale bar, 100 µm. (D) Top, scheme of alternative injection site. Bottom, still images of neutrophil recruitment to muscle infection sites at indicated times in the presence (Hypo) and absence (Iso) of osmotic tissue damage signaling. Image panels represent n=40 (Hypo + PA) and n=37 (Iso + PA) injection experiments. Arrow, injection site. Scale bars, 100 µm. (E) Average neutrophil recruitment to muscle injection sites as a function of osmotic tissue damage signaling. Shaded area, SEM of n injection experiments (parentheses). Please also see Figure S2.
Figure 3
Figure 3. Selective suppression of osmotic tissue damage signaling decreases post-infection survival
Meier-Kaplan plots of post-infection survival of PA-infected larvae in the presence or absence of osmotic tissue damage signaling. Different lines in each graph refer to different PA concentrations. Asterisks, log-rank test p<0.05. Parentheses, number of injection experiments.
Figure 4
Figure 4. Absence of osmotic tissue damage signaling does not block microbial detection
(A) Left panel, Venn plot of significantly (padj<0.05), at least two times up- or down-regulated mRNAs at 60 min after PA ear infection in the absence (Iso + PA) or presence (Hypo + PA) of osmotic tissue damage signaling. Right panel, log2-fold regulation of intersection gene set (blue). Large font, known LPS-downstream effectors. See Table S1 for more detail. Results are derived from n=3 independent mRNAseq experiments (B) In situ hybridization for il1b mRNA. Left panel, representative images of different classes of staining patterns observed in indicated number of injection experiments (parentheses, right panel). Right panel, quantification of staining pattern frequency.
Figure 5
Figure 5. cPla2 integrates tissue damage and microbial cues
(A) Summary of genetic pathway perturbations (indicated below the graph). Two measurements are given: the HR-index (red, pie charts), and average leukocyte recruitment curves (orange circles, simplified 3-timepoint-plot format: 0’, 45’, 90’, see Figure S3A). Upper graph section, color code indicates respective bathing conditions. Lower graph section, color code indicates injection conditions. Note, the injection buffer tonicity is always the same as bath tonicity. Error bars, SEM of indicated number (parentheses) of injection experiments. Red lines, Fisher’s exact test p<0.05 comparing HR indices. Orange lines, t-test p<0.05 comparing average leukocyte numbers at 90’. cPla2 wt mRNA, cPla2 overexpression by injection of mRNA into one-cell stage embryos. cPla2 S498A mRNA, cPla2 phosphorylation site-mutant overexpression by injection of mRNA into one-cell stage embryos. cpla2 MO, published splice blocking morpholino (Enyedi et al., 2013). fleN mutant PA (multi-flagellated), ear injection of a flagella mutant of PA (Feinbaum et al., 2012). LPS mutant PA, ear injection of O-antigen mutated PA (ORF_11) (Feinbaum et al., 2012). myd88 MP MO, misprime control morpholino. myd88 MO, published translation blocking myd88 morpholino (van der Sar et al., 2006). Note, the Hypo + PA reference set is the same as in other figures. (B) Regulatory diagrams juxtaposing the classical view (upper panel, muted colors) of inflammation initiation with the model supported by this study (lower panel). Classically, either PAMPs released by microbes or DAMPs released by lytic host cells are thought to function as primary triggers for inflammation and leukocyte recruitment. This logical OR relationship is depicted by its standard symbol in the upper diagram. Our study suggests that only tissue damage can function as primary, inflammatory trigger in vivo, and that microbial signals act as amplifiers of tissue damage signaling. Depicted on the left side is the necrotic sequence of cell morphology changes. Arrows mark the proposed regulatory role of each necrotic intermediate. Whereas classic DAMP signaling is triggered by cell lysis, the tissue damage signaling pathway proposed in this study is triggered upstream of cell lysis by cell- and nuclear swelling. Note that necrotic cell lysis causes strong additional nuclear swelling through extranuclear colloid osmotic pressure decrease, which can further activate nuclear cPla2 (Enyedi et al., 2016). For simplicity, this post-lytic nuclear swelling is omitted from the diagram. PAMP, pathogen associated molecular pattern. DAMP, damage associated molecular pattern. PRR, pattern recognition receptor. cPLA2, cytosolic phospholipase A2. AA, arachidonic acid. Please also see Figure S3 and S4.

Comment in

References

    1. Bäckhed F, Ley RE, Sonnenburg JL, Peterson DA, Gordon JI. Host-bacterial mutualism in the human intestine. Science (80-.) 2005;307:1915–1920. - PubMed
    1. Barton GM, Medzhitov R. Toll-like receptor signaling pathways. Science (80-.) 2003;300:1524–1525. - PubMed
    1. Bloes DA, Kretschmer D, Peschel A. Enemy attraction: bacterial agonists for leukocyte chemotaxis receptors. Nat. Rev. Micro. 2015;13:95–104. - PubMed
    1. Chen GY, Nuñez G. Sterile inflammation: sensing and reacting to damage. Nat. Rev. Immunol. 2010;10:826–837. - PMC - PubMed
    1. Dacheux D, Goure J, Chabert J, Usson Y, Attree I. Pore-forming activity of type III system-secreted proteins leads to oncosis of Pseudomonas aeruginosa-infected macrophages. Mol. Microbiol. 2001;40:76–85. - PubMed

Publication types

MeSH terms

Substances